Getting Started with GitKraken Insights
Last updated: March 2026
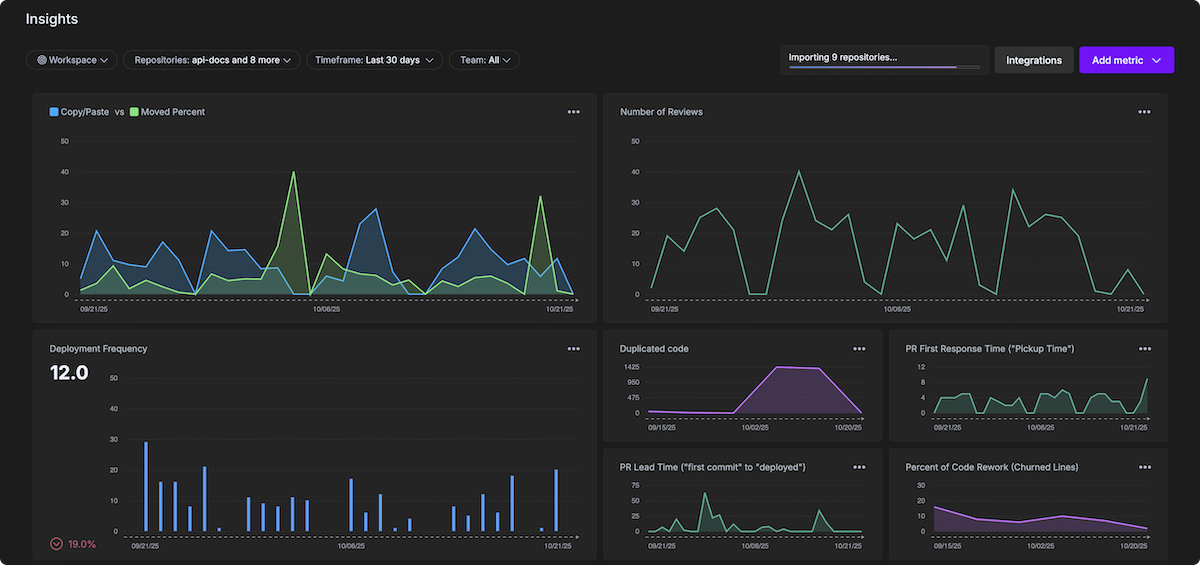
GitKraken Insights turns raw Git data into clear, useful metrics for developers and leaders. It pulls code activity, pull requests, issues, and CI/CD results into a single view that fits directly into existing workflows. Instead of surface-level stats, GitKraken Insights shows how work connects to team goals and points out ways to improve flow and productivity.
Requirements
GitKraken Insights (available by request)
Lead, Admin, or Owner
GitHub, GitLab, Bitbucket, Azure DevOps, Jira Cloud
Claude Code, Cursor, GitHub Copilot (optional)
Request Access
GitKraken Insights is available by request only. To get started,
request a guided tour.
A member of the GitKraken team will contact you right away to walk you through GitKraken Insights and explain how to enable access for your organization.
Note: GitKraken Insights is a standalone product. Contact GitKraken to get started.
Connecting Your Data
Once your access is approved, you can connect GitKraken Insights to your repositories and configure settings for your organization. Currently, Insights supports connections with GitHub, GitLab, Bitbucket, Azure DevOps, and Jira Cloud.
In addition, you can connect AI providers to enable AI Impact insights (like Duplicated Code, Prompt Acceptance Rate, and more).
Import Your Repositories
-
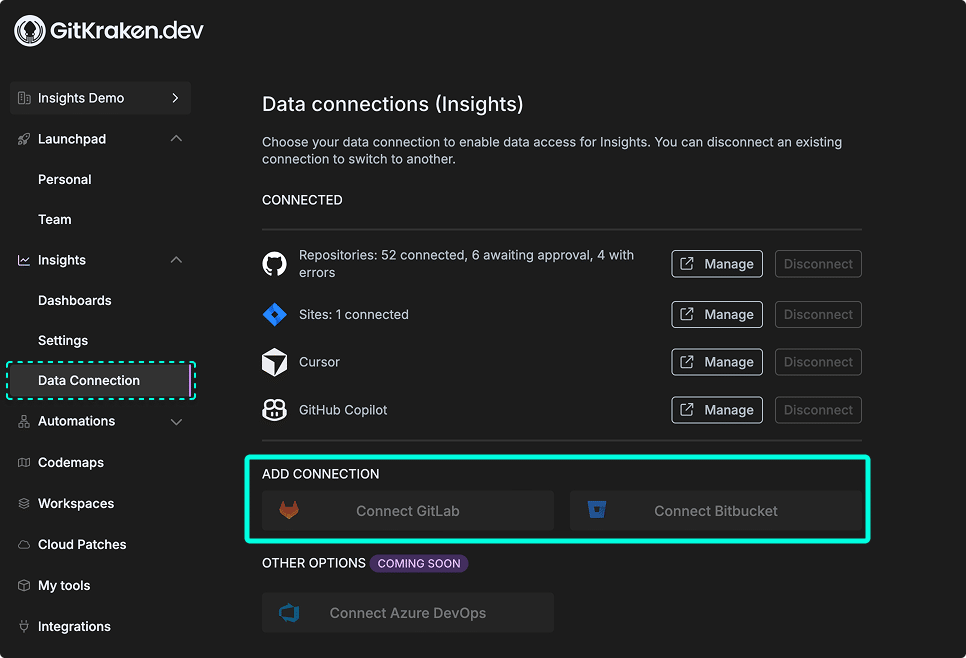
In GitKraken.dev, go to Insights > Data Connection.
-
Click to connect with GitHub, GitLab, Azure DevOps, Claude Code, Cursor, GitHub Copilot, Bitbucket, or Jira Cloud.
-
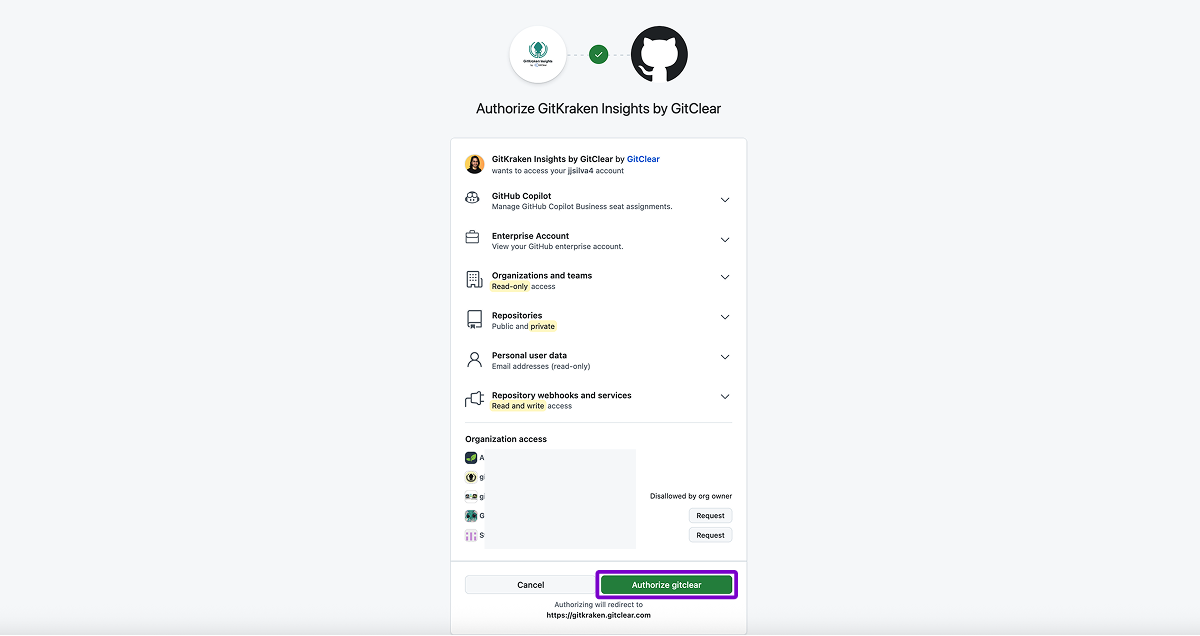
Authorize GitKraken Insights to connect with GitHub.
-
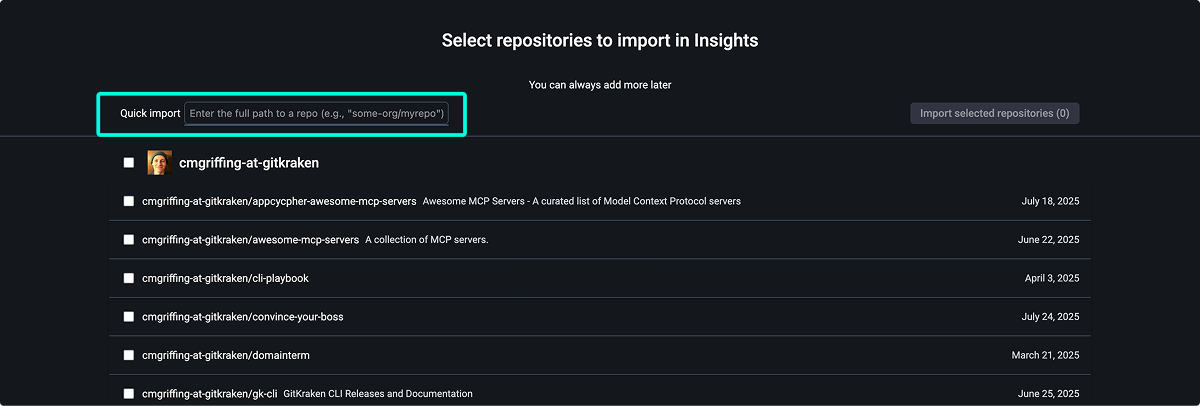
Select which repositories to track. Use the filter option at the top of the page to quickly narrow down the list.
Avoiding GitHub API Rate Limits
If you’re importing a large number of repositories, depending on size and commit history, you may encounter GitHub’s hourly API rate limits. This can temporarily throttle other GitHub services used by your organization.
To avoid this, additional members of your organization can connect to GitKraken Insights using a Lead role. When multiple people are connected, the app distributes processing across their GitHub tokens to help avoid throttling.
After the initial import is complete, rate limit issues are unlikely to recur.
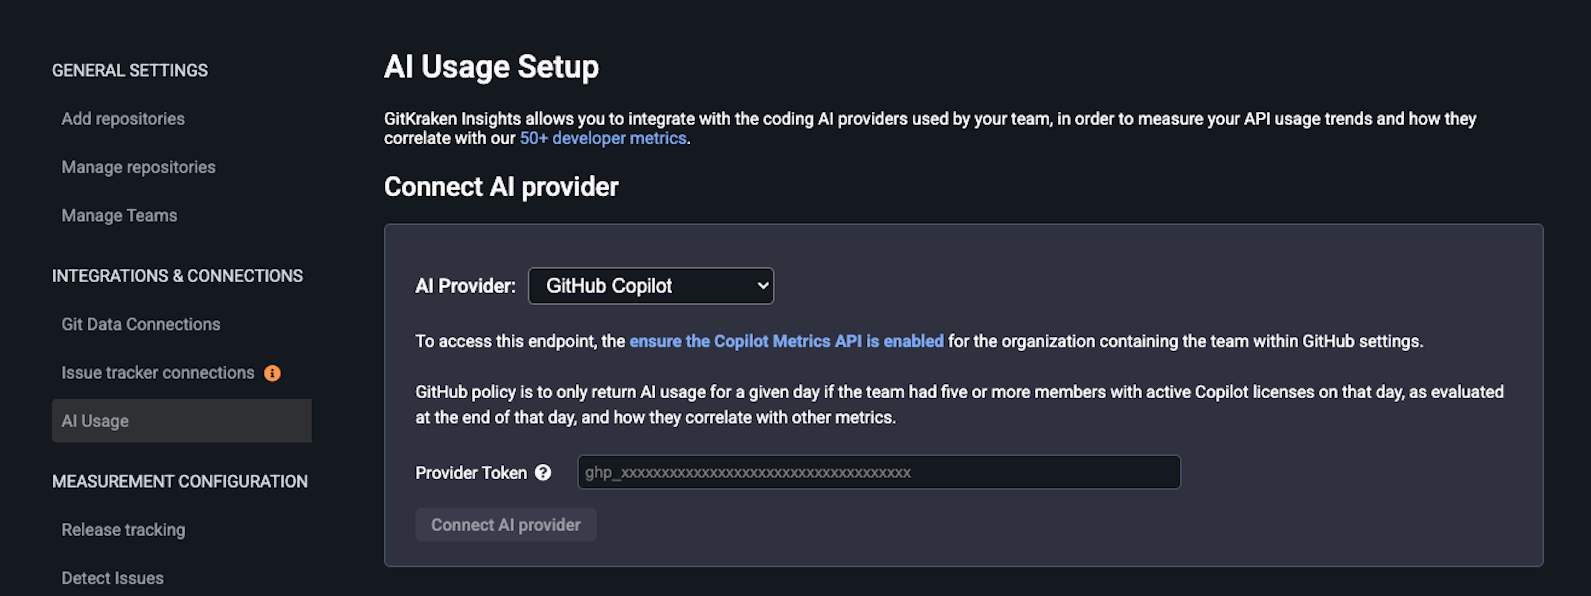
Connect an AI Provider (Optional)
As of February 2026, GitKraken Insights only supports connections with Claude Code, Cursor and GitHub Copilot to enable AI insights.
To enable AI Impact insights, connect your preferred AI provider:
-
In GitKraken.dev, go to Insights > Data Connection.
-
Click to
Managewith Claude Code, Cursor or GitHub Copilot. -
In the new window, select the AI provider you wish to connect with and enter the provider Token.
-
Click Connect AI Provider to finish the connection.
Confirm Your Profile Details
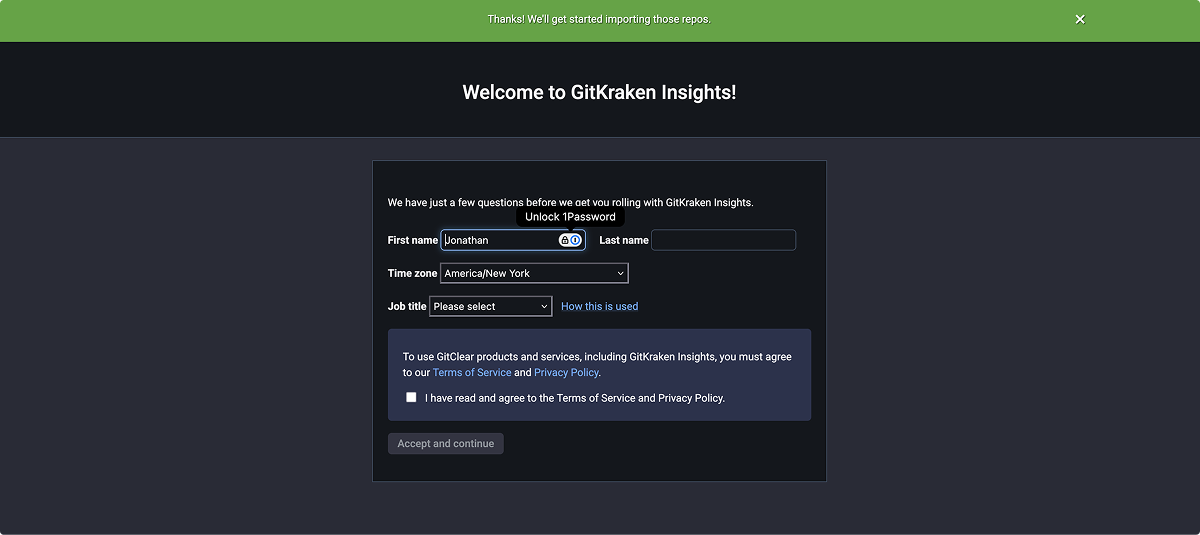
After connecting repositories, confirm your personal details:
- First and last name
- Time zone
- Job role
Monitor Data Import Progress
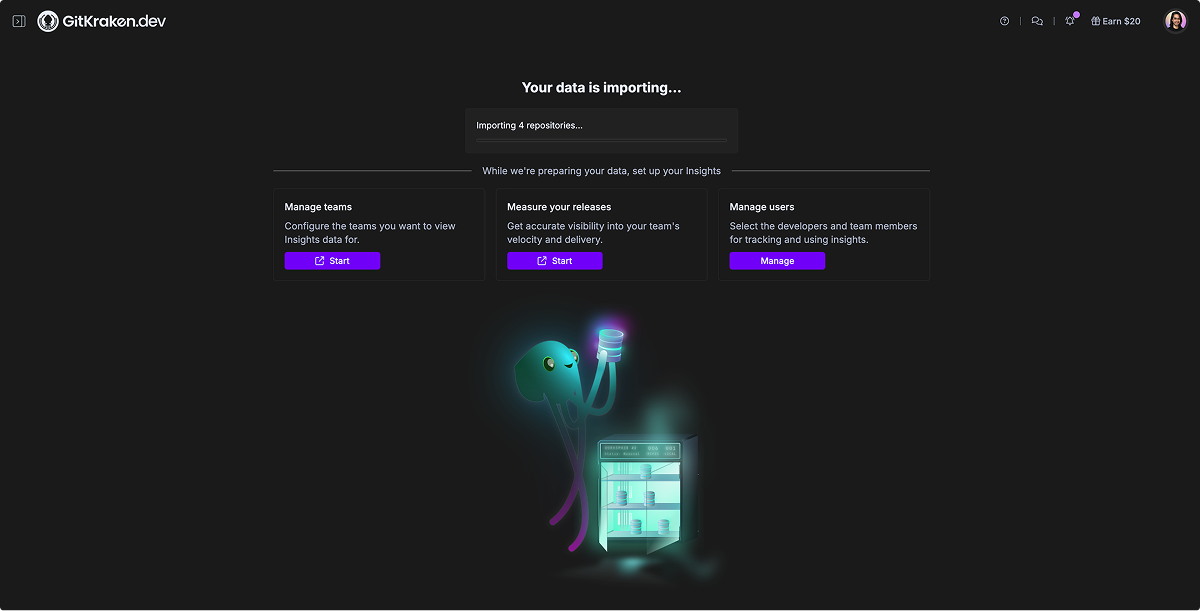
Once setup is complete, GitKraken Insights will begin importing your repository data.
- Past month’s activity appears within a few hours.
- Full year’s activity is usually ready within one to two days.
- Track import progress anytime from the Dashboard tab.
Exploration Notes: Version 3 — Interactive with Plugin JS
Approach: Builds on V2’s semantic HTML with gki- classes, adding interactive elements that leverage the plugin’s externally-loaded JavaScript. Native HTML5 <details>/<summary> provides collapsible sections without JS. The GKI Docs Helper plugin provides all styling, JS features, and the 3-column page template.
Key discovery — plugin solves JS limitation: WordPress strips inline <script> tags from post content imported via Git It Write. The GKI Docs Helper plugin bypasses this entirely by loading JS externally via wp_enqueue_scripts. All interactive features are now fully functional.
Plugin features active: Auto-generated “On this page” TOC (right sidebar with scroll spy), card search/filter (type to filter the card grid), reading progress bar (gradient top bar), back-to-top button, smooth anchor scrolling, Parsedown cleanup, and the 3-column layout with category navigation.
V3-specific features:
- Native collapsible sections — the API Rate Limits warning uses
<details>/<summary>(no JS required) - Searchable card grid — cards have
data-searchattributes; the plugin adds a filter input above the grid - Scroll-aware TOC — highlights the active section as you scroll, auto-scrolls the sidebar to keep it visible
Maintenance: Medium. Same as V2 (full HTML), but interactive features are zero-maintenance — they come from the plugin JS automatically. Adding headings to the page updates the TOC. Adding cards with data-search makes them searchable. No per-file JS needed.