Last updated: March 2026
GitKraken Insights tracks four Code Quality metrics that assess engineering health by examining bug fix ratios, test and documentation investment, code age, and effort distribution. Use these metrics to monitor technical debt, maintain development quality, and align team investments with maintainability goals.
Plan: GitKraken Insights
Platform: Browser only via gitkraken.dev
Role: Lead, Admin, or Owner
Prerequisite: Connected repositories
| Metric | Definition |
|---|---|
| Bug Work Percent | Ratio of work spent fixing bugs vs all other work |
| Documentation and Test Percent | Percent of work related to tests and documentation |
| Code Change Rate | Age of code being changed |
| Code Change by Operation | Code changes organized by type (test, documentation, front-end, back-end) |
Bug Work Percent indicates code quality debt. Documentation and Test Percent indicates maintainability investment. Use both to assess whether the team is building sustainably. Code Change Rate reveals technical debt hotspots in older code. Code Change by Operation shows how effort distributes across system layers.
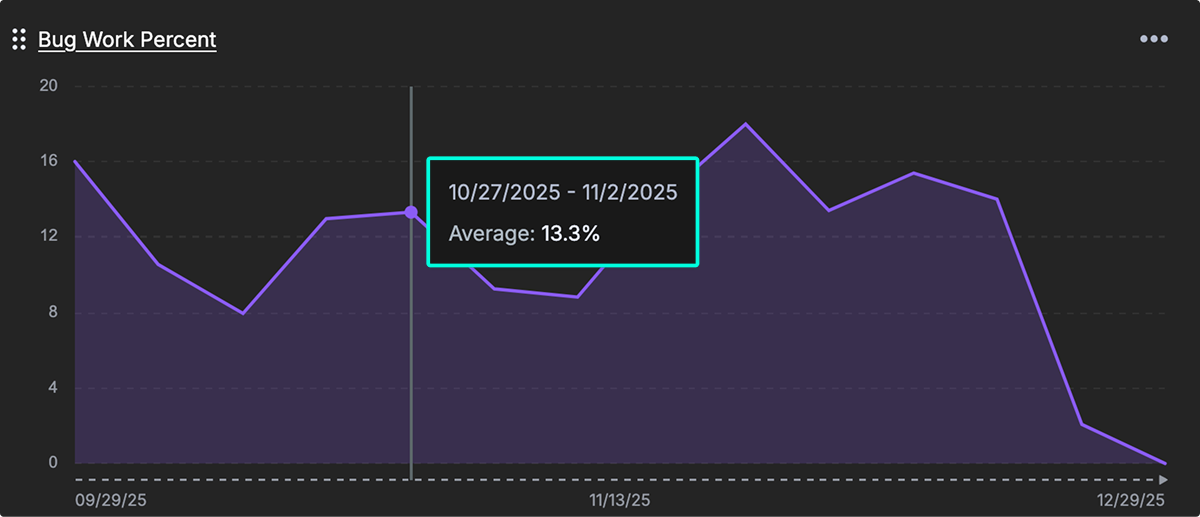
Bug Work Percent
Definition: The ratio of development work spent on fixing bugs vs everything else.
Bug Work Percent reveals the proportion of engineering work consumed by fixing defects versus feature development. It helps leaders assess the level of code quality debt and prioritize efforts toward refactoring and process improvements.
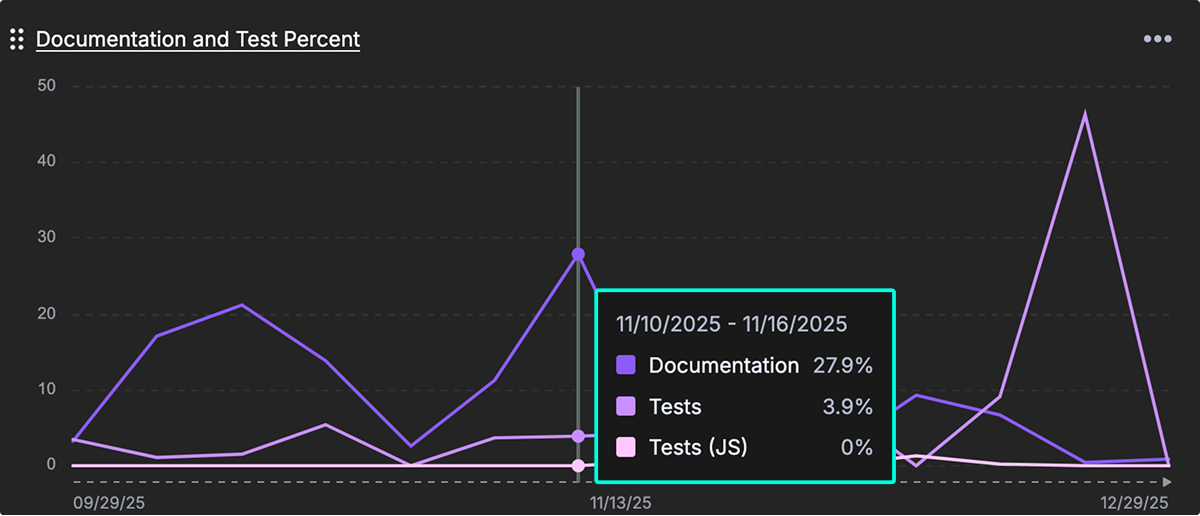
Documentation and Test Percent
Definition: The percent of work related to tests and documentation.
Documentation and Test Percent shows the proportion of engineering work dedicated to writing tests and documentation. These activities are strong indicators of long-term maintainability and help improve onboarding efficiency, especially in growing or distributed teams.
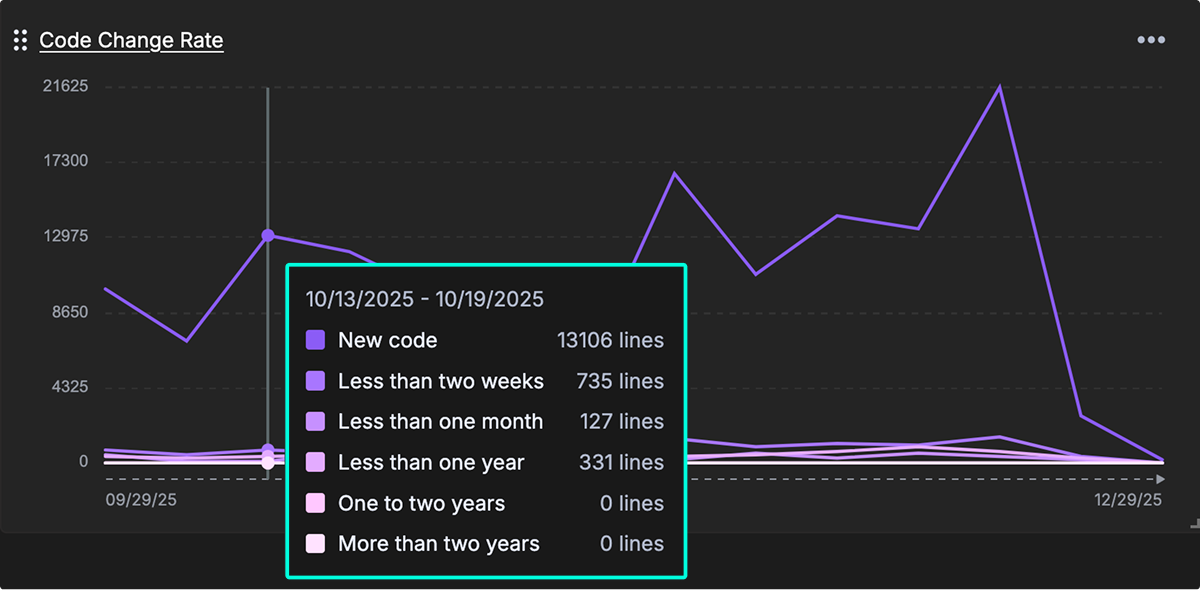
Code Change Rate
Definition: How old the code is that is being changed.
Code Change Rate tracks the age of code being modified. Frequent changes to older code may reveal technical debt hotspots, signaling the need for deeper refactoring or even system replacement. Teams can use this data to prioritize stability improvements and architectural upgrades.
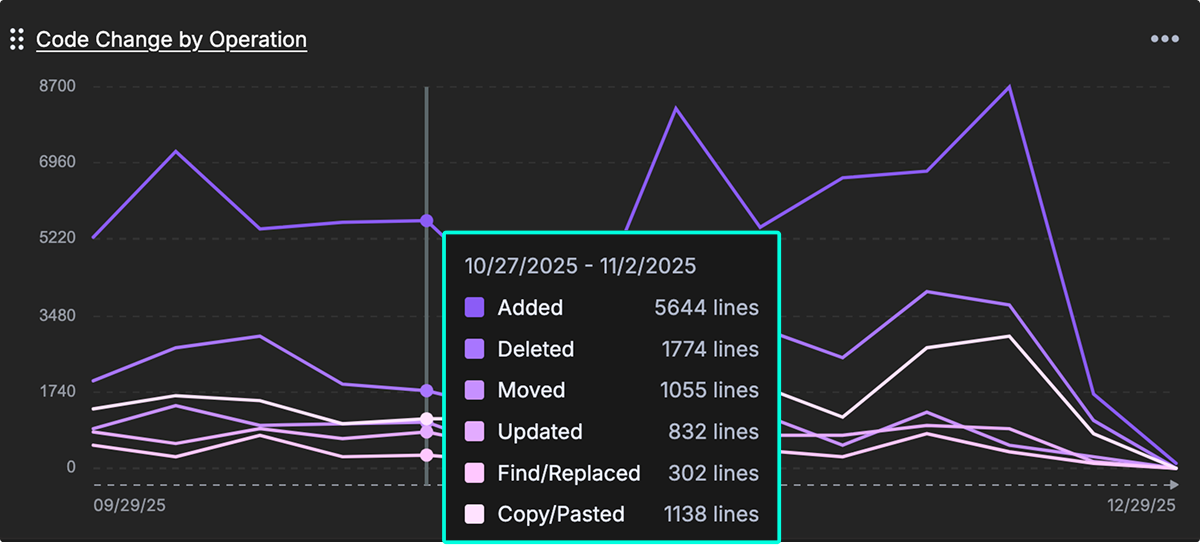
Code Change by Operation
Definition: The measure of code changes organized by the type of change. (e.g., “test,” “documentation,” “front-end,” “back-end”)
Code Change by Operation breaks down engineering work by category, such as testing, documentation, front-end, and back-end development. It helps teams visualize where their effort is being spent and supports more strategic allocation of resources across system layers and quality activities.