Last updated: March 2026
What GitKraken Insights dashboards display
GitKraken Insights dashboards display Git activity, pull requests, issues, and CI/CD results in a single view. Each dashboard contains configurable metric widgets that can be filtered by workspace, repository, timeframe, and team. This page covers how to create dashboards, duplicate dashboards, add metrics, customize layouts, apply trendlines, and filter data.
Plan: GitKraken Insights
Platform: Browser only via gitkraken.dev
Role: Lead, Admin, or Owner
Prerequisite: Connected repositories (see Getting Started)
Adding Metrics
Before you can add metrics, complete these setup steps:
- Request a guided tour to get access.
- Connect GitKraken Insights to your GitHub account.
- Wait for your repositories to finish importing. For detailed instructions, see the Getting Started guide.
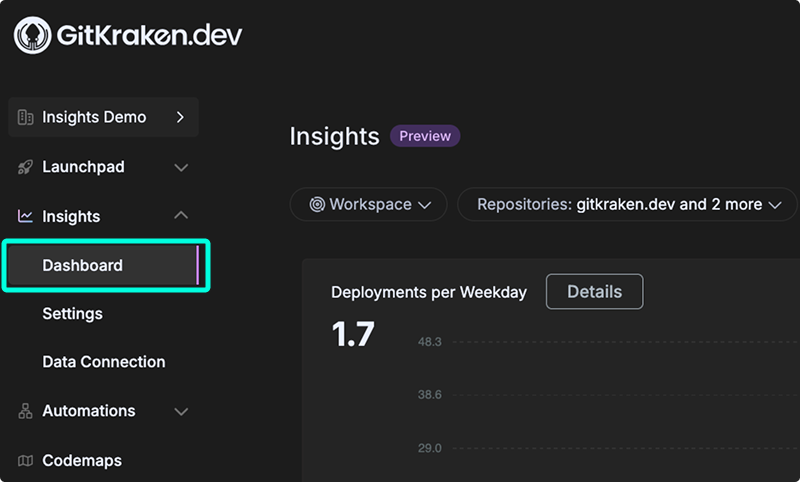
Once setup is complete, open the Insights > Dashboard tab from gitkraken.dev.
Creating Dashboards
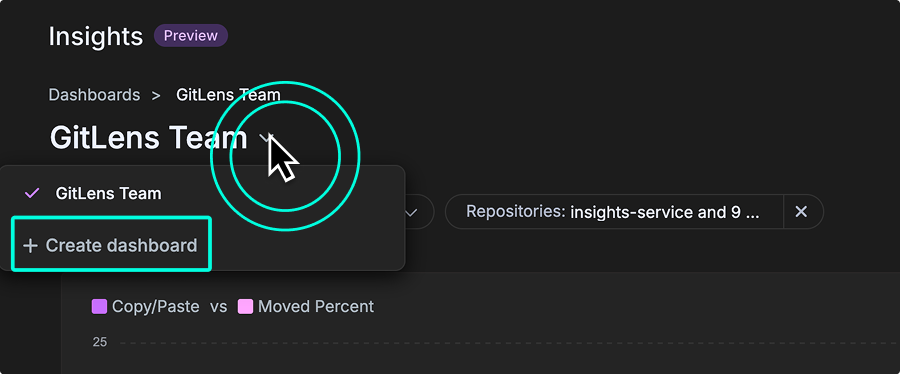
You can create multiple dashboards in GitKraken Insights to organize metrics by team, project, or focus area. To begin, use the dropdown menu in the top-left corner of the dashboard view. From there, select + Create dashboard to open the creation modal.
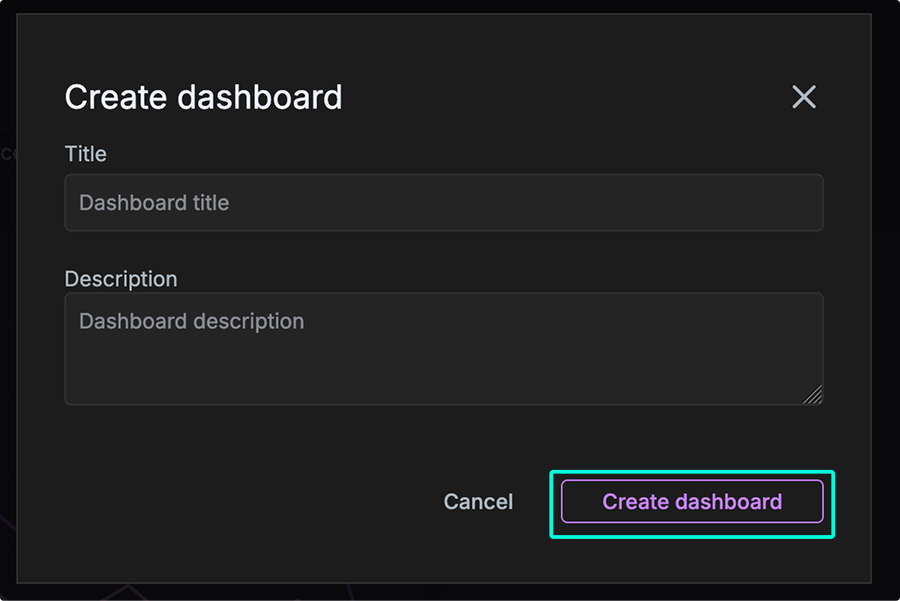
In the modal, enter a Title and optional Description to help distinguish this dashboard from others. Creating focused dashboards is especially helpful for tracking metrics by repository group, product area, or individual contributor activity.
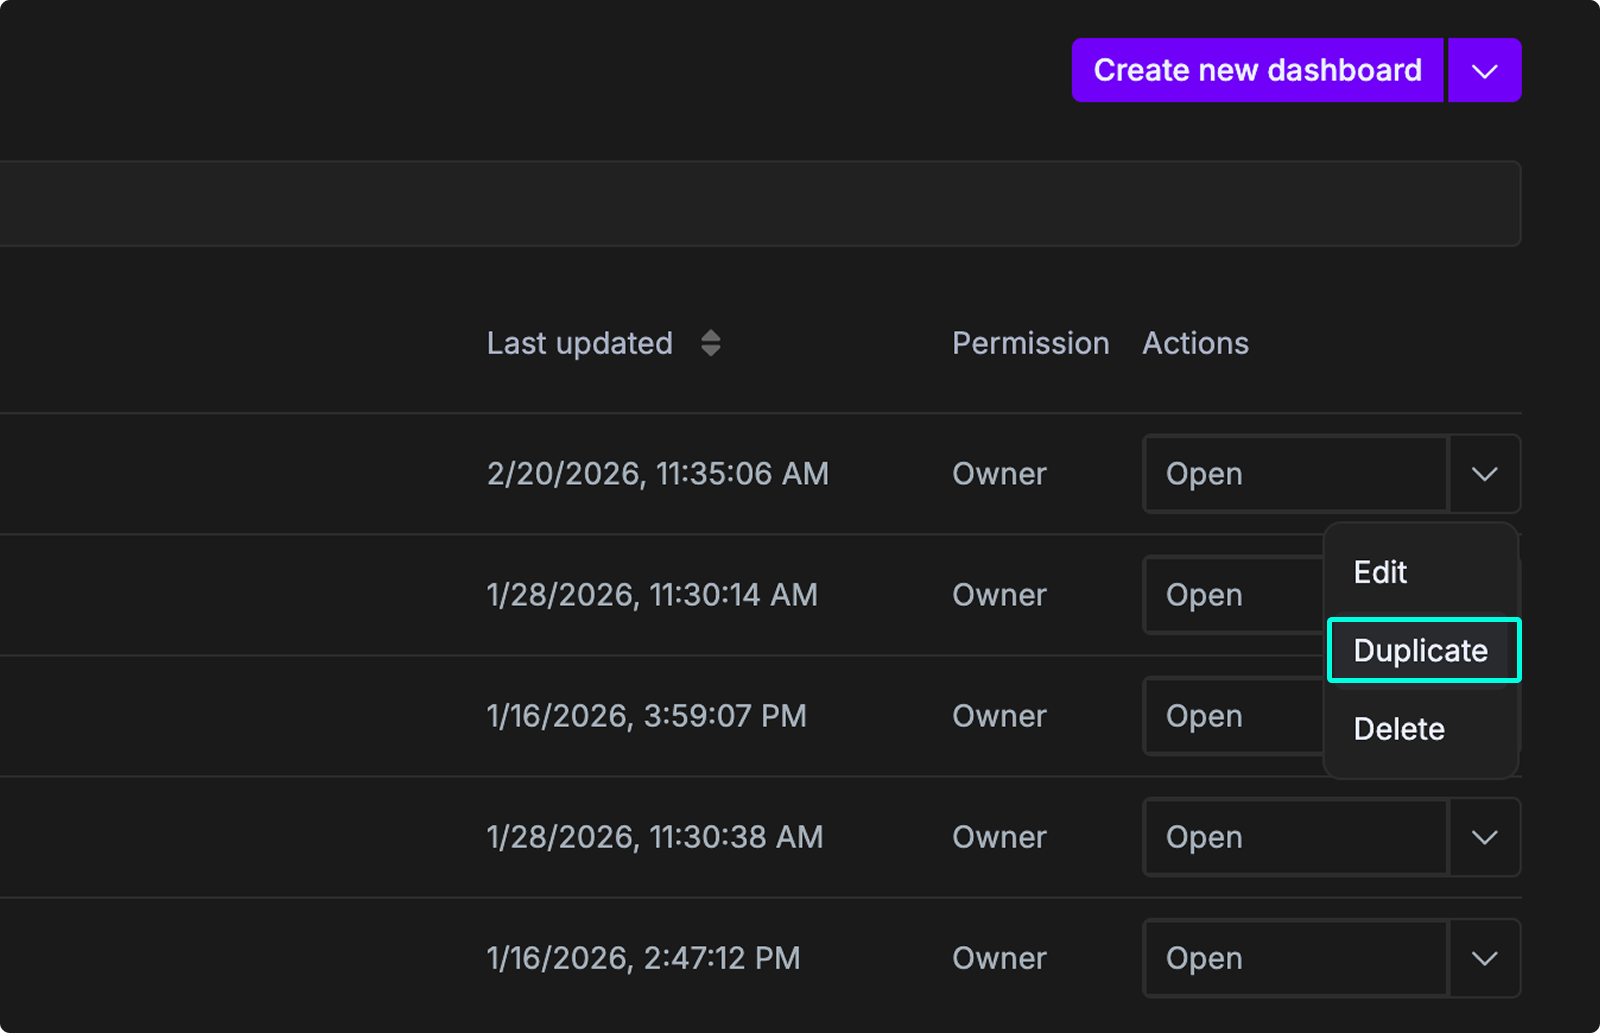
Duplicate a dashboard
You can duplicate an existing dashboard to quickly create a new version with the same configuration, filters, and widgets. This is useful when you want to reuse a dashboard as a starting point without modifying the original.
Steps
- Navigate to Dashboards in GitKraken Insights.
- Locate the dashboard you want to duplicate.
- Click the Actions dropdown on the right side of the dashboard row.
- Select Duplicate.
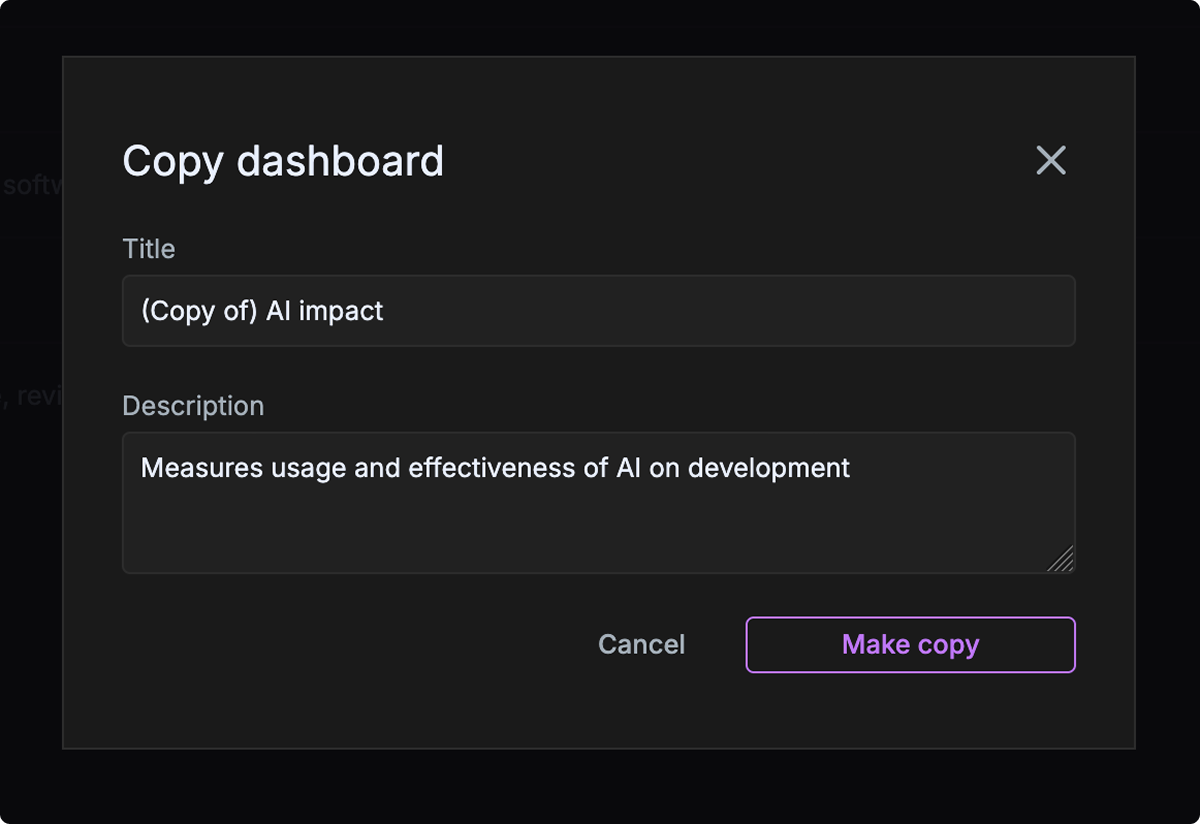
- In the Copy dashboard dialog, review or update the following fields:
- Title: Enter a name for the new dashboard.
- Description: (Optional) Update the description.
- Click Make copy.
The duplicated dashboard will appear in your dashboard list with the same configuration as the original.
Notes
- Duplicating a dashboard does not affect the original dashboard.
- The new dashboard is created with the same widgets and filters as the original.
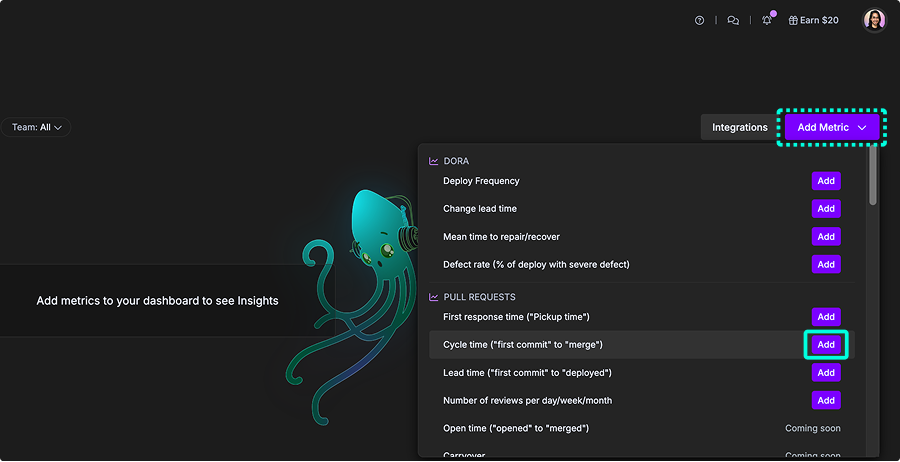
Add a metric
- In the Dashboard view, click the Add Metric button in the top-right corner.
- Browse the list of available widgets, grouped by category (for example, DORA and Pull Requests).
- Click Add next to the metric you want to display on your dashboard.
Browse available metrics
| Metric | Category | Description |
|---|---|---|
| Deploy Frequency | DORA | Total deployments per period |
| Change Lead Time | DORA | First commit to deployment |
| Mean Time to Repair/Recover | DORA | Defect detected to fix deployed |
| Defect Rate | DORA | % of deployments with critical defect |
| First Response Time | Pull Requests | PR opened to first review/comment |
| Cycle Time | Pull Requests | First commit to PR merge |
| Lead Time | Pull Requests | First commit to deployed |
| Number of Reviews | Pull Requests | Review volume per period |
| Open Time | Pull Requests | PR opened to merged |
| PRs Abandoned | Pull Requests | PRs closed without merge |
| PRs Merged Without Review | Pull Requests | PRs merged with no review |
| PR Comments | Pull Requests | Total comments on PRs |
| PR Size/Effort | Pull Requests | Aggregate diff delta of merged PRs |
| Code Review Hours | Pull Requests | Avg review time per committer |
| Copy/Paste vs Moved % | AI Impact | Duplicated vs refactored code |
| Duplicated Code | AI Impact | Lines in duplicate blocks |
| Percent of Code Rework | AI Impact | Recently written code modified again |
| Post PR Work Occurring | AI Impact | Follow-up work after merge |
| Active Users | AI Impact | Unique users in AI providers |
| Suggestions | AI Impact | AI-generated suggestions (by total lines) |
| Prompt Acceptance Rate | AI Impact | % of prompt suggestions accepted |
| Tab Acceptance Rate | AI Impact | % of tab suggestions accepted |
| Bug Work Percent | Code Quality | Bug fix work vs all other work |
| Documentation and Test % | Code Quality | Work related to tests and documentation |
| Code Change Rate | Code Quality | Age of code being changed |
| Code Change by Operation | Code Quality | Changes by type (test, doc, FE, BE) |
| Commit Count | Velocity | Commits to connected repositories |
| Estimated Coding Hours | Velocity | Estimated time spent coding |
Customize widget layout
Widgets on the dashboard can be customized to fit your needs.
- Resize widgets: Each widget is available in two sizes: small or large. Drag and drop the lower-right corner of a widget to adjust its size.
- Rearrange widgets: Drag and drop from the upper-left corner of a widget to move it into a new position on the dashboard.
- One per dashboard: Only one copy of each metric can be placed on a dashboard.
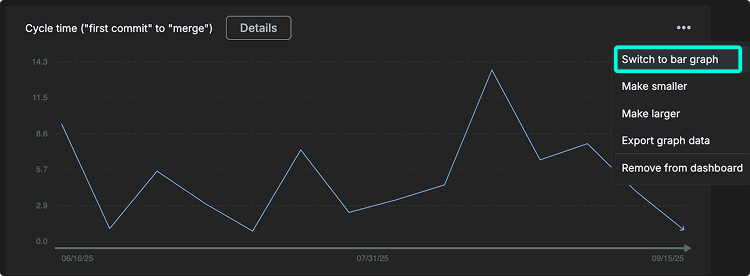
- Widget menu: From the menu in the upper-right of each widget, you can switch between line and bar graph types, resize the widget between large or small, export the graph data, or remove the widget from the dashboard.
- Switch graph type Switch between line graphs, area graphs, or bar graphs.
Note: Currently, each user can create only one dashboard per organization. Support for multiple dashboards per user is planned for a future release.
Add trendlines to charts
You can add trendlines to any chart in GitKraken Insights to help visualize patterns over time. These overlays make it easier to understand whether your metrics are improving, declining, or fluctuating, and how consistently.
How to add a trendline
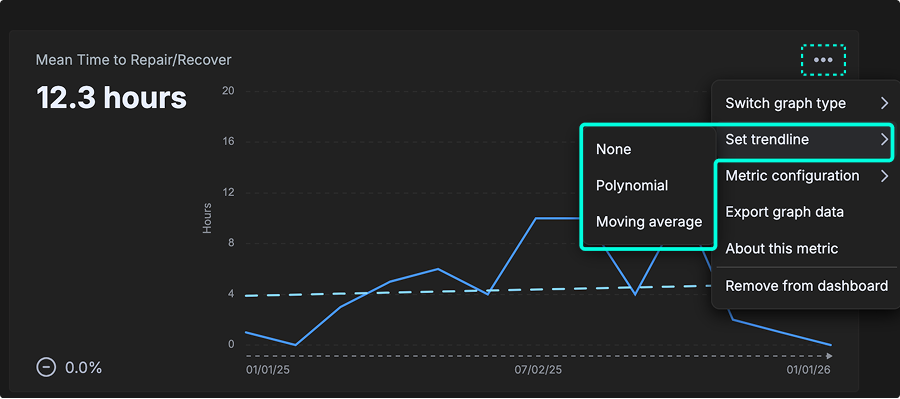
- On any dashboard widget, click the ⋯ (three dots) menu in the upper-right corner.
- Select Set trendline.
- Choose one of the available types:
- None: No trendline is shown.
- Linear: Adds a straight line through the data to show steady upward or downward trends.
- Polynomial: Adds a curved line that reveals acceleration, deceleration, or changing directions in the data.
- Moving Average: Smooths out short-term fluctuations to highlight the overall pattern, especially useful for noisy or jumpy data.
Use Linear to see if a metric is steadily improving or declining over a long period. Use Polynomial when you suspect acceleration, deceleration, or directional changes. Use Moving Average when data is noisy and you need to smooth out short-term fluctuations.
Tip: Use trendlines to spot steady improvements, regressions, or shifts in behavior across delivery, review, or quality metrics.
Filter dashboard data
The dashboard may be filtered by Workspace, Repositories, Timeframe, and Team.
-
Workspace: Workspaces are preset groups of repositories. They also enable other key features across gitkraken.dev, GitKraken Desktop, GitLens, and the GitKraken CLI such as Launchpad and multi-repo actions. On the dashboard, you can filter to only display data for the repositories in your chosen Workspace. To create your first workspace, go to gitkraken.dev/workspaces.
-
Repositories: Refers to the list of repos imported into GitKraken Insights. Check or uncheck repositories to fine-tune the data. Use the search feature to quickly locate repos by name.
-
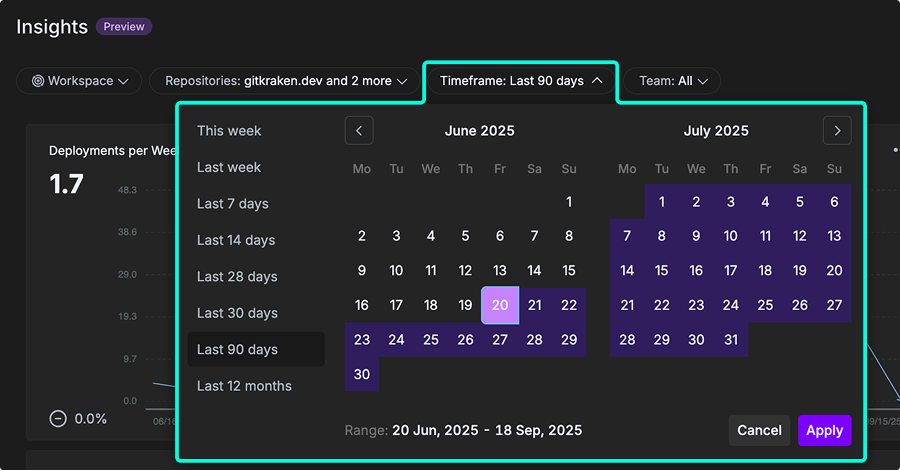
Timeframe: Sets the timebox for the dashboard. Options include This Week, Last Week, Last 7 days, Last 14 days, Last 28 days, Last 30 days, Last 90 days, Last 12 months, or a custom date range.
-
Team: Filters the data by a group of users. To configure teams, go to Insights > Settings > Setup your Team.
Alerts
Alerts notify you when a metric crosses a defined threshold. GitKraken Insights checks thresholds hourly and delivers notifications as a daily digest. You can configure alerts per metric widget, scoped to specific repositories and teams.
Create an alert
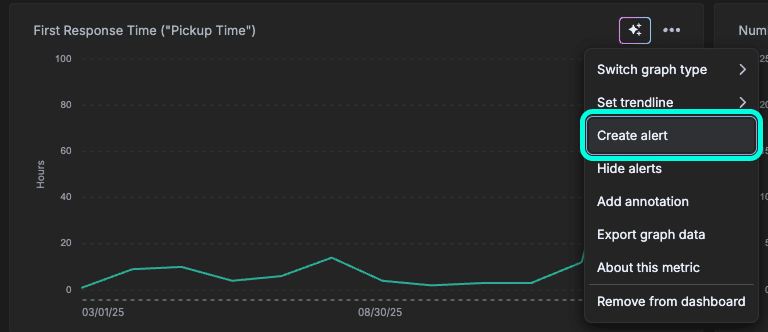
- On any dashboard widget, click the ⋯ (three dots) menu in the upper-right corner.
- Click Create alert:
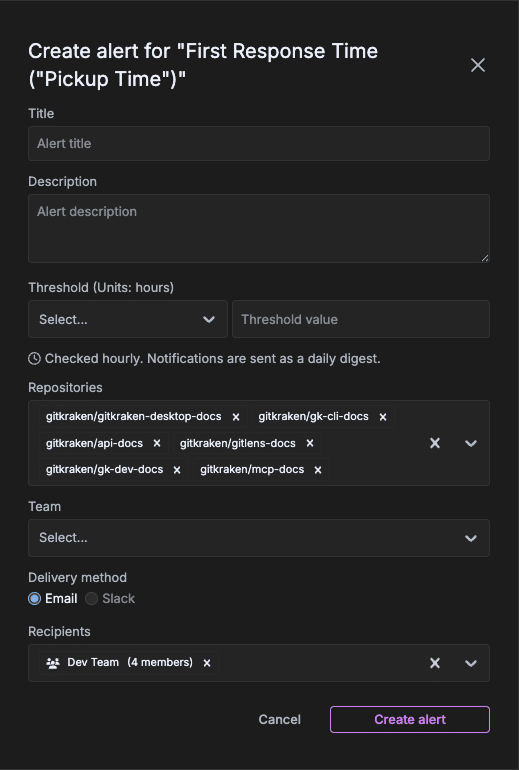
- Complete the following fields:
- Title: Enter a name for the alert.
- Description: (Optional) Add context to help identify the alert’s purpose.
- Threshold: Select a comparison operator (Equal, Greater than, Greater than or equal to, Less than, or Less than or equal to) and enter a numeric threshold value. The unit displayed matches the metric’s unit (for example, developers, hours, or percent).
- Repositories: Select the repositories this alert applyes to.
- Team: (Optional) Filter alert data to a specific team.
- Delivery method: Choose Email or Slack.
- Recipients: Select the users (or teams) who receive the notification.
Note: GitKraken Insights checks alert thresholds hourly. Notifications are sent as a daily digest, not in real time.
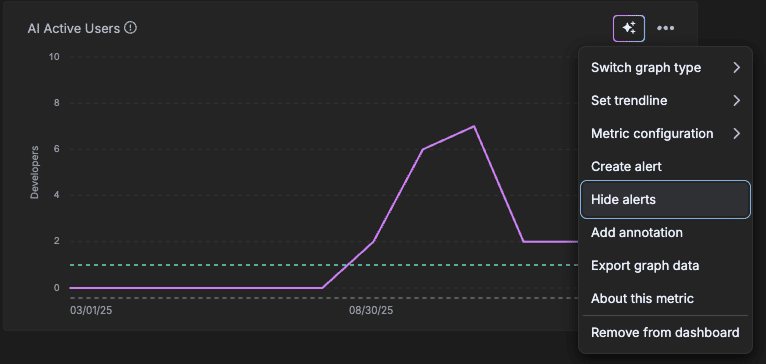
Hide alerts
To hide alert threshold lines from a metric chart without deleting them:
- Click the ⋯ (three dots) menu on the widget.
- Select Hide alerts.
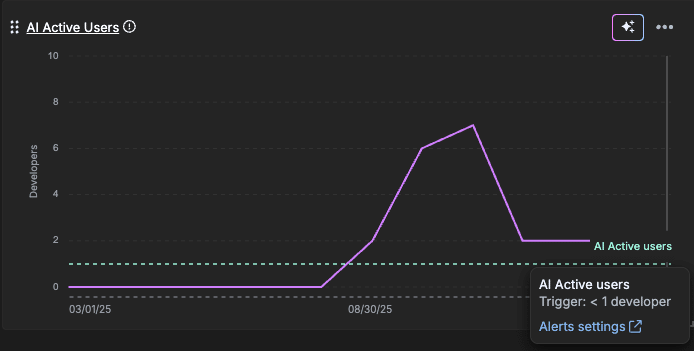
View alerts on a chart
When an alert is active and visible, GitKraken Insights displays a dashed threshold line on the metric chart. Clicking on Alert label shows a tooltip with the alert name, the trigger condition, and a link to Alerts settings.
Manage alerts
The Insights alerts page lists all alerts you have created. To access it, click Alerts settings from any alert tooltip on a chart.
Each row in the table displays the metric name, alert title, description, threshold, the user who created the alert, and an enabled toggle. From the actions menu on the right side of each row, you can Edit or Delete the alert.
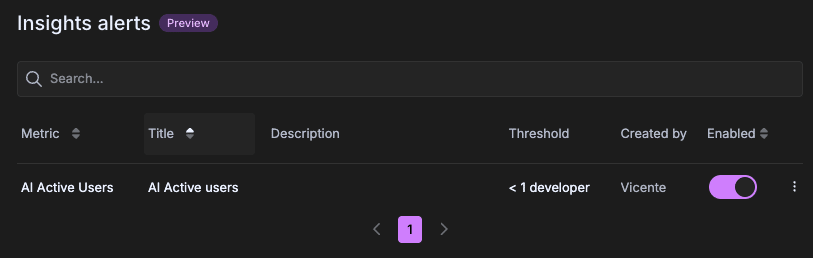
Note: The Insights alerts page is currently in Preview.
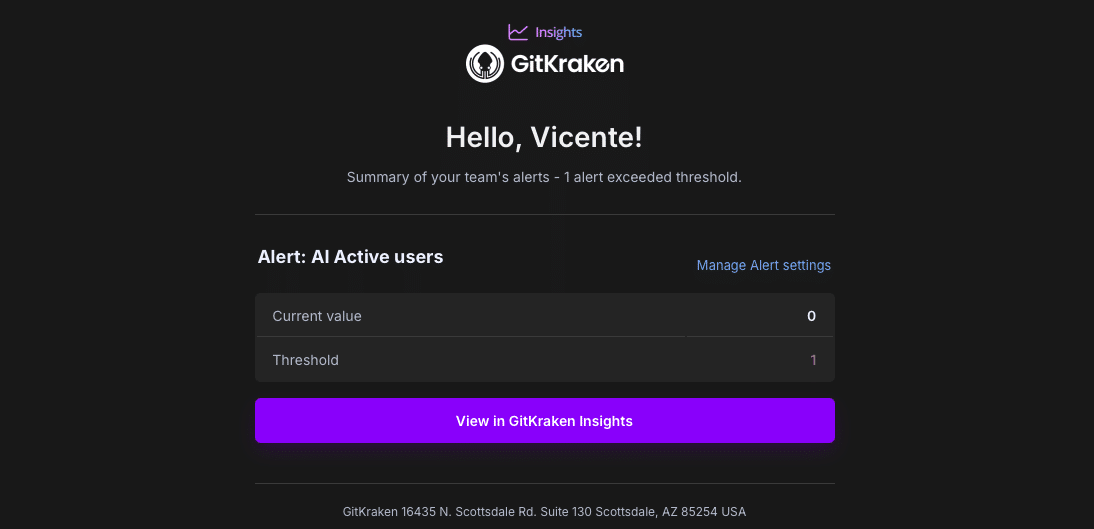
Alert notifications
When an alert threshold is exceeded, GitKraken Insights sends a daily digest email to all configured recipients. The email includes a summary of each triggered alert showing the current metric value, the configured threshold, and a View in GitKraken Insights button that opens the relevant dashboard. A Manage Alert settings link is also included to access the Insights alerts page directly.