Last updated: March 2026
GitKraken Insights tracks ten Pull Request metrics that measure how code changes move through review and deployment. These metrics highlight slowdowns, surface patterns in reviews, and uncover blockers that may affect delivery. Pull Request data comes from connected GitHub, GitLab, or Bitbucket repositories.
Plan: GitKraken Insights
Platform: Browser only via gitkraken.dev
Role: Lead, Admin, or Owner
Prerequisite: Connected repositories with pull request data (GitHub, GitLab, or Bitbucket)
| Metric | Measures | Unit | Rolling Window |
|---|---|---|---|
| First Response Time | PR opened to first review/comment | Hours | 7-day avg |
| Cycle Time | First commit to PR merge | Days | 7-day avg |
| Lead Time | First commit to deployed | Days | 7-day avg |
| Number of Reviews | Review volume per period | Count | 7-day |
| Open Time | PR opened to merged | Days | N/A |
| PRs Abandoned | PRs closed without merge | Count | N/A |
| PRs Merged Without Review | PRs merged with no review | Count | N/A |
| PR Comments | Total comments on PRs | Count | N/A |
| PR Size / Effort | Aggregate diff delta of merged PRs | Diff delta | N/A |
| Code Review Hours | Avg review time per committer | Hours | N/A |
Cycle Time vs Open Time vs Lead Time: Cycle Time starts at the first commit; Open Time starts when the PR is opened; Lead Time extends through deployment. Use Cycle Time for overall delivery speed, Open Time for review bottlenecks, and Lead Time for the full development-to-production pipeline.
First Response Time helps identify reviewer engagement gaps. PRs Abandoned and PRs Merged Without Review signal process health. PR Size/Effort and Code Review Hours help balance reviewer workload.
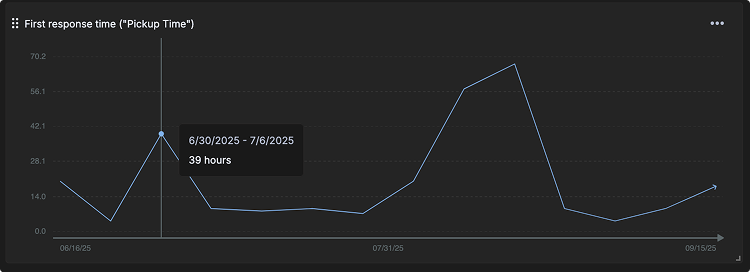
First Response Time (“Pickup Time”)
Definition: The time measured from when a PR is opened to when the 1st review or comment is left on a PR.
First Response Time shows how long each pull request within a selected timeframe took to have a first response (comment or review). Values are expressed in hours and averaged over a 7-day period. Shorter pickup times indicate faster reviewer engagement and healthier collaboration.
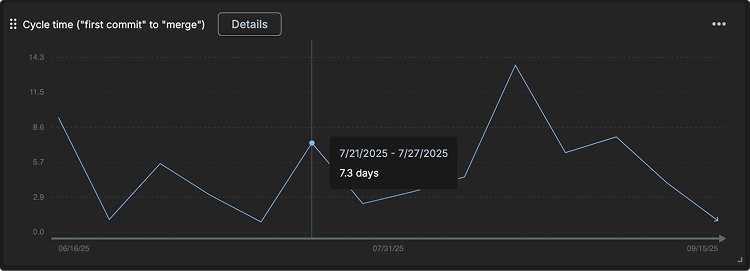
Cycle Time (“first commit” to “merge”)
Definition: The time measured between the 1st commit of a PR to when the PR is merged.
Cycle Time shows how long each pull request within a selected timeframe took to merge from the time the first commit was made. Values are expressed in days and averaged over a 7-day period. Cycle time provides insight into overall delivery speed, highlighting how quickly work moves from coding to production.
The Details view offers deeper analysis.
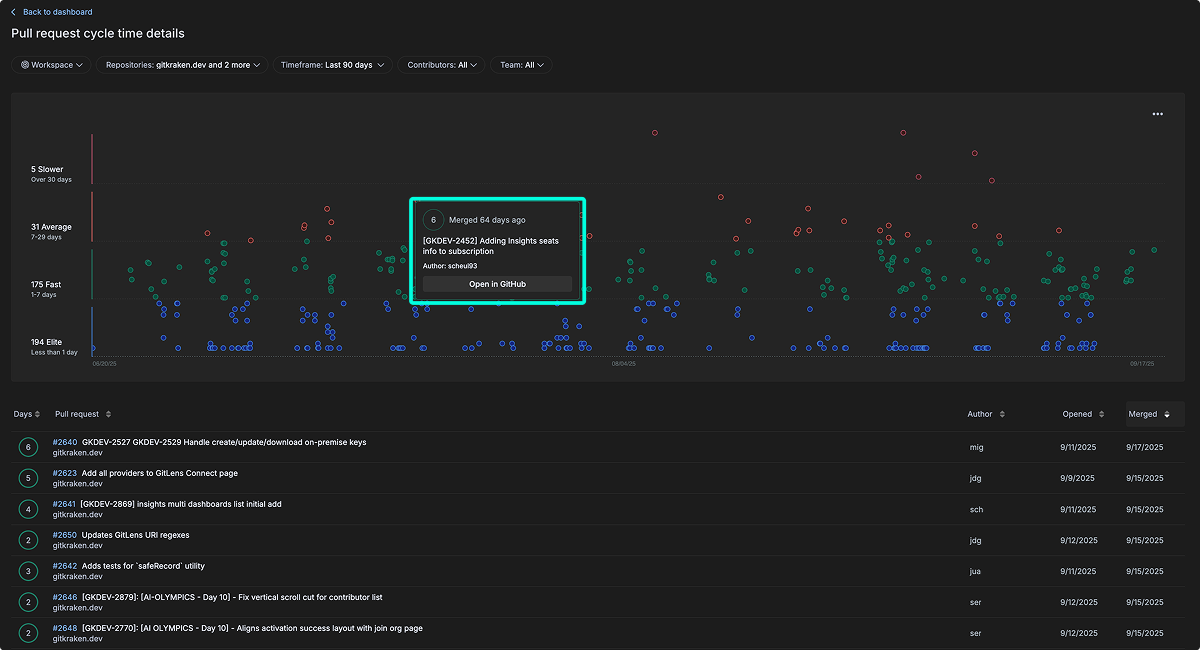
- Pull requests are grouped into four categories by duration:
- Elite: Less than 1 day
- Fast: 1–7 days
- Average: 7–29 days
- Slower: Over 30 days
- Each node in the scatter plot is interactive, showing PR details such as time since merge, PR name, author, and a link to open directly in GitHub.
- A sortable table lists all PRs below the chart. You can sort by Days, Pull Request name, Author, Date Opened, or Date Merged.
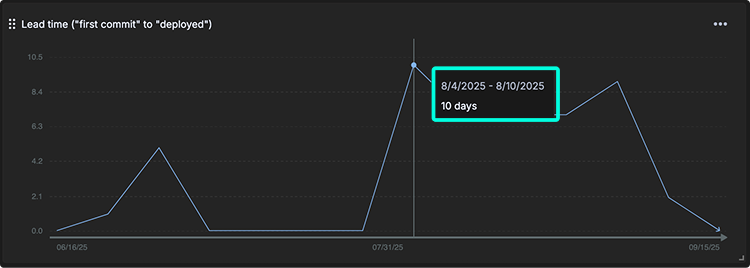
Lead Time
Definition: The time from the first commit in a pull request to when that code is deployed to production. This bridges development and deployment activities.
Lead Time shows how long each pull request within a selected timeframe remained open, measured from when the PR was created until it was merged. Values are expressed in days and averaged over a 7-day period.
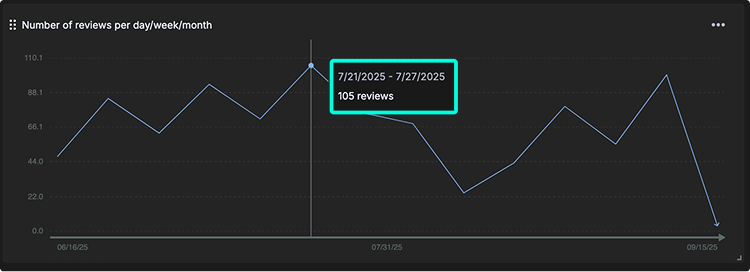
Number of Reviews per Day/Week/Month
Definition: The volume of code reviews being conducted, indicating team review capacity and activity.
Number of Reviews shows the total number of reviews (all types) completed over a given period of time. Values are expressed in reviews and averaged over a 7-day window. Tracking review activity helps teams understand collaboration patterns and reviewer workload across different timeframes (daily, weekly, or monthly).
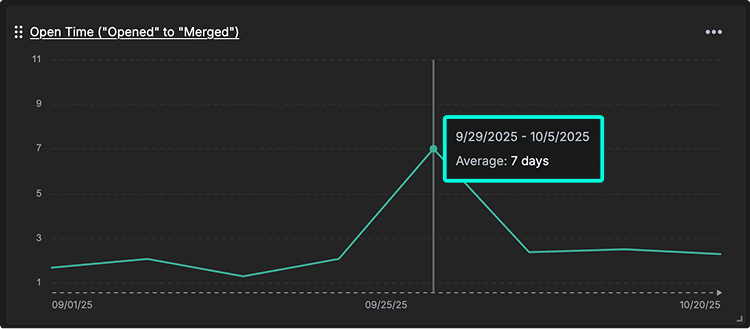
Open Time (“opened” to “merged”)
Definition: The time between when a pull request is opened and when it is merged.
Open Time captures the duration from pull request creation to merge. It differs from PR Cycle Time, which starts from the first commit. Open Time isolates the review and approval phase, helping teams identify delays specifically related to code review and collaboration workflows.
The Open Time details view provides a stacked bar chart that visualizes average PR open durations per repository across time intervals. Each bar segment represents a specific repository, allowing teams to compare performance across services.
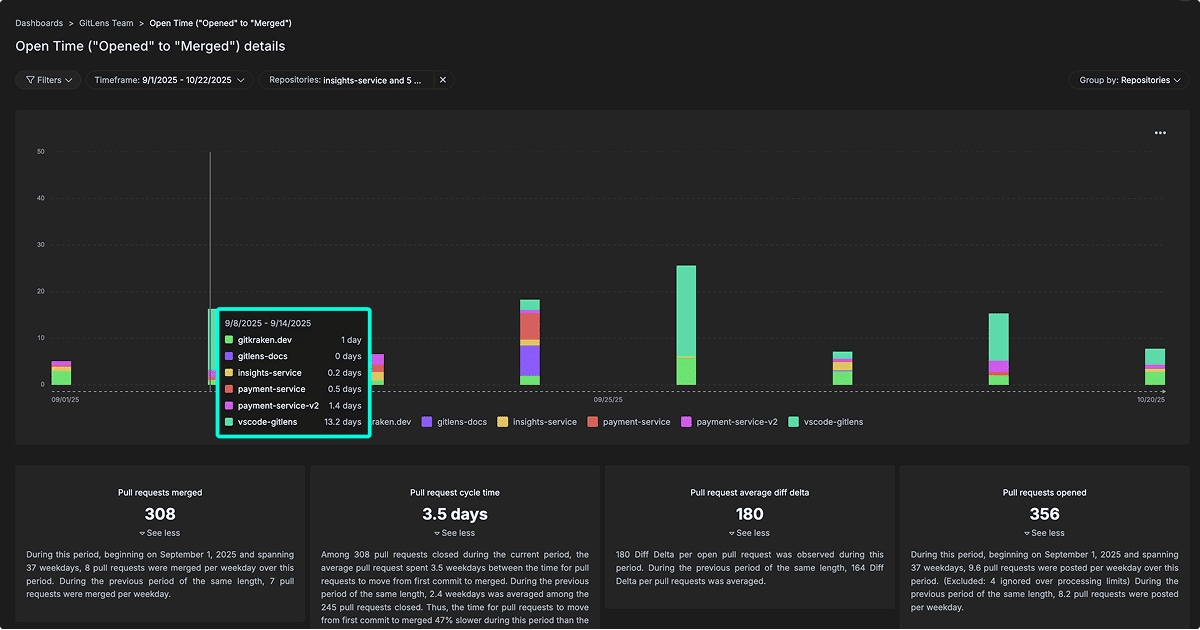
Key highlights include:
- Hover insights: Hovering over bars shows per-repository open time for the selected week.
- Repository comparison: See how review duration varies across services.
- Summary metrics:
- Pull requests merged
- Pull request cycle time
- Pull request average diff delta
- Pull requests opened
These metrics help teams identify trends, uncover review bottlenecks, and monitor efficiency over time.
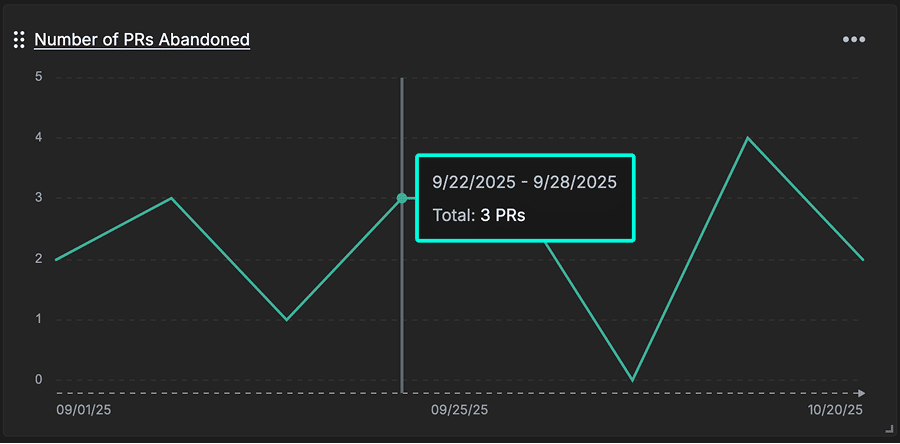
Number of PRs Abandoned
Definition: Number of pull requests closed without being merged.
PRs Abandoned can reveal wasted engineering effort, scope management issues, or breakdowns in work planning and prioritization. A high abandonment rate may indicate unclear requirements, excessive rework, or bottlenecks earlier in the development process.
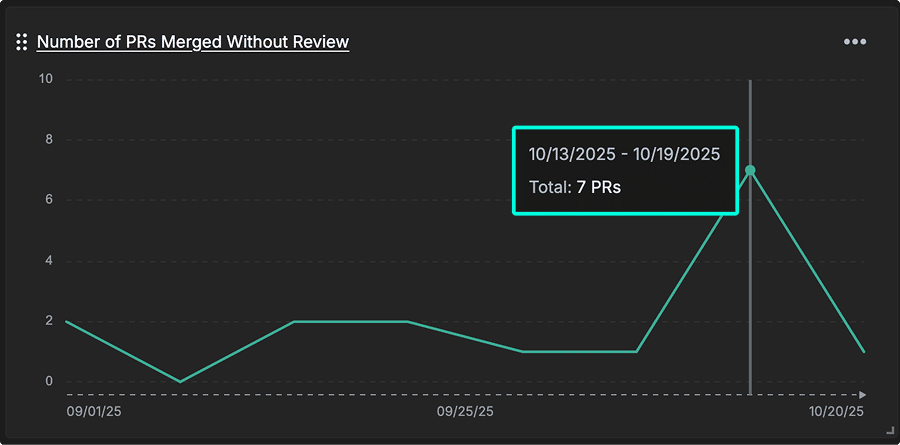
Number of PRs Merged Without Review
Definition: The number of pull requests that have been merged without any (bot or human) review.
PRs Merged Without Review can indicate potential process gaps in peer review enforcement. It identifies PRs integrated without peer review, exposing quality risks and gaps in your code review governance that could lead to production defects.
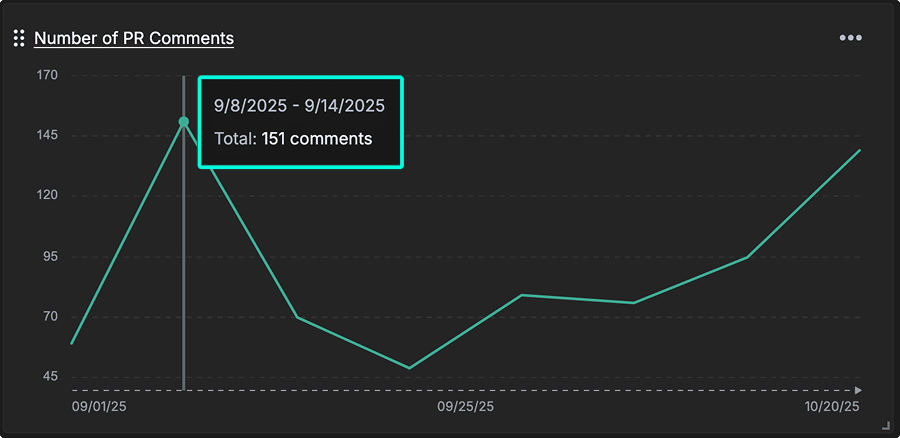
Number of PR Comments
Definition: The total number of comments left on your pull requests.
Number of PR Comments measures the level of engagement during code reviews, revealing how thoroughly code is being evaluated. A high number of comments can indicate active feedback, knowledge sharing, and mentorship opportunities across the team.
PR Size / Effort
Definition: The aggregate amount of change (diff delta) across all pull requests that were merged during a given time period.
PR Size / Effort reflects the total effort involved in the review process. It is calculated by summing the “Before PR submitted” and “While under review” diff delta values, representing the total size of the pull request and the energy required for its review.
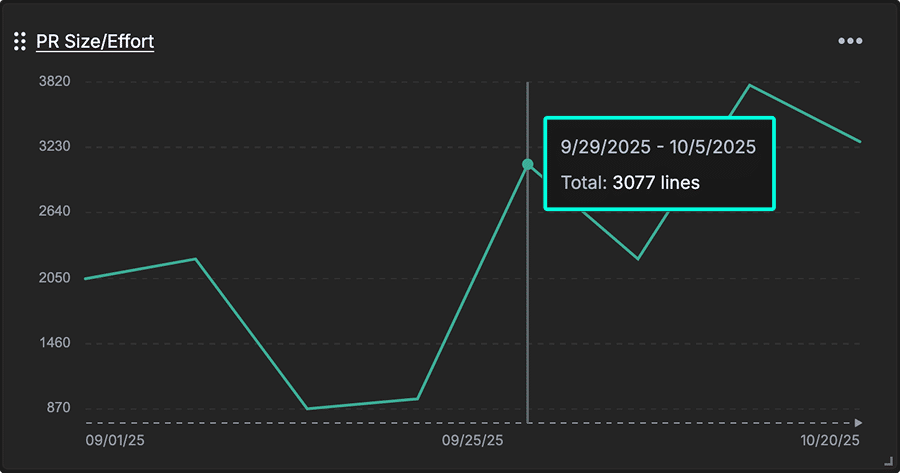
By aggregating the total change volume across merged PRs, this helps teams balance workload distribution and recognize when PRs may be too large for effective review.
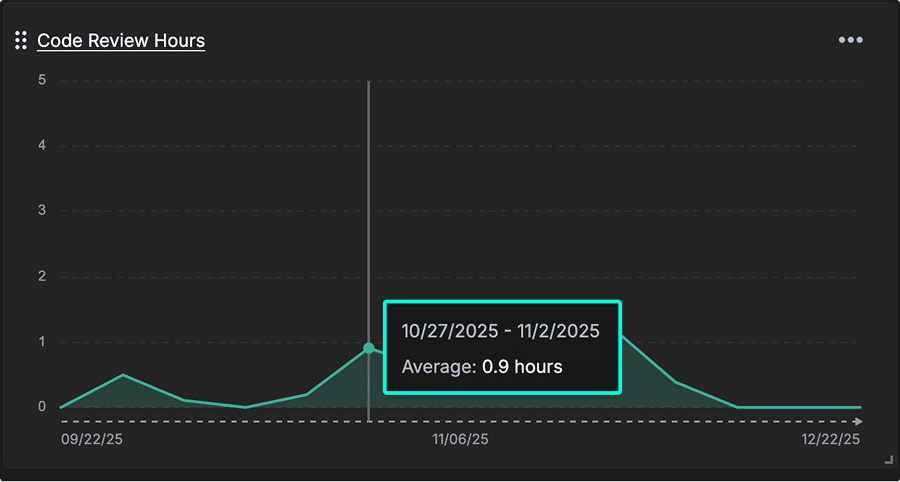
Code Review Hours
Definition: Average time spent in hours during the “review period” of your team’s pull requests.
How it’s calculated: Total review hours / number of committers.
Code Review Hours quantifies the average time investment in reviewing code. It helps leaders evaluate whether code review capacity aligns with delivery goals and whether review processes need optimization to support team velocity and quality.