
Last updated: March 2026
GitKraken Insights tracks four DORA (DevOps Research and Assessment) metrics, which are standardized performance indicators developed by a Google Cloud research team to measure DevOps effectiveness. These metrics help organizations identify areas for improvement and deliver software more efficiently and reliably. Before DORA metrics populate, configure release tracking rules in Metric Settings.
Plan: GitKraken Insights
Platform: Browser only via gitkraken.dev
Role: Lead, Admin, or Owner
Prerequisite: Release tracking rules configured in Metric Settings
| Metric | Measures | Unit | Rolling Window |
|---|---|---|---|
| Deploy Frequency | Total deployments per period | Count | Selected timeframe |
| Change Lead Time | First commit to deployment | Days | 7-day |
| Mean Time to Repair/Recover | Defect detected to fix deployed | Business hours | 7-day |
| Defect Rate | % of deployments with critical defect | Percentage | 7-day |
Use Deploy Frequency to assess release cadence and delivery pace.
Use Change Lead Time to measure end-to-end delivery speed from code to production.
Use MTTR to evaluate incident response capability and recovery speed.
Use Defect Rate to assess deployment stability and release quality.
Deploy Frequency
Definition: The total number of deployments, as determined by the rules configured in the Releases settings.
Deploy Frequency shows how often new code is released or deployed to production, measured as the number of deployments per day, week, or other selected timeframe.
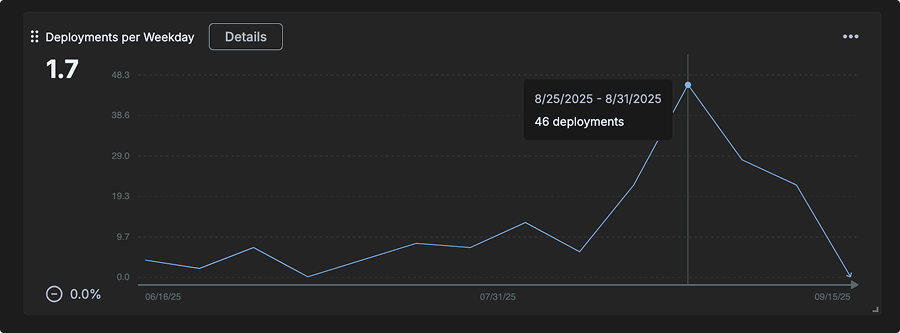
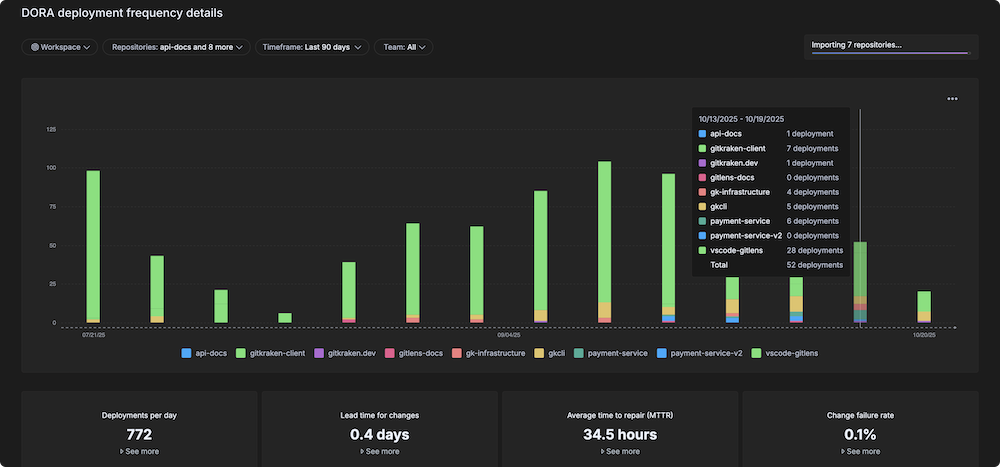
In addition to the main chart, the following submetrics are displayed when you click the Details button:
- Deployments per day
- Lead time for changes
- Average hours to repair (MTTR)
- Change failure rate
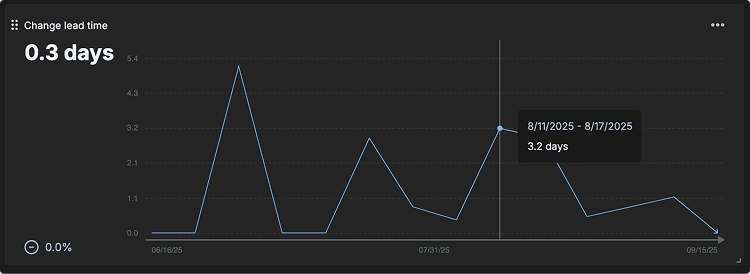
Change Lead Time
Definition: The time between the first commit linked to an issue (such as a Jira ticket) and when the associated code is deployed.
Change Lead Time shows how long each pull request within a selected timeframe took to go from the first commit until it was deployed. Values are expressed in days and are calculated over a rolling 7-day period.
Mean Time to Repair/Recover (MTTR)
Definition: Business hours between “defect detected” and “final fix deployed”.
MTTR measures the business hours between when a defect is detected and when the final fix is deployed to production. Values are expressed in business hours and calculated over a rolling 7-day period. Lower MTTR indicates that teams can respond quickly to incidents and minimize downtime.
Defect Rate
Definition: The percentage of deployments that resolve a critical defect. Defect Rate measures the stability and quality of your deployment process.
Defect Rate shows the number of defects detected over time. Values are expressed as defects over a rolling 7-day window. A lower defect rate indicates a more stable and reliable deployment process.
