

Last updated: August 2026
This is the hands-on setup guide for AI Adoption in GitKraken Insights. By the end, your organization’s git-provider activity and AI coding-tool telemetry will be flowing into the dashboard, your developers will be mapped to a single identity, and your team will have access.
Plan on 15–20 minutes of active work, plus up to a day for the first full data sync to complete in the background.
Plan: GitKraken Insights
Platform: Browser only via gitkraken.dev
Role: Owner or Admin (to manage data connections)
Where you’ll work: Insights → Settings → Data ConnectionsNote — this is the Next-Gen (AI Adoption) connection flow. AI Adoption connects through org-level access tokens in Settings → Data Connections. This is different from the classic Insights repository connection (the OAuth “Authorize GitHub” flow described in Getting Started with GitKraken Insights). If you’re setting up AI Adoption, follow the steps on this page.
Before you start — gather access
The single biggest cause of stalled setups is discovering mid-stream that the person doing the setup doesn’t have the right permissions. Setup almost always touches two or three different people across your org. Line them up before you begin.
| You’ll need… | …who has this access | What they’ll do |
|---|---|---|
| GitKraken organization | Owner or Admin of your gk.dev org | Manage data connections, invite teammates |
| GitHub (if you use GitHub) | An org admin (to create an org-level token) | Generate the GitHub access token |
| Bitbucket (if you use Bitbucket) | An admin of your Bitbucket workspace | Generate a Bitbucket-specific Atlassian API token |
| Azure DevOps (if you use Azure DevOps) | An account that can see every project you want to sync | Create a PAT with Code (Read) |
| GitLab (if you use GitLab, cloud or self-managed) | An account with access to the groups you want to sync | Create a PAT with the read_api scope |
| A self-hosted server (GitHub Enterprise Server, Bitbucket Data Center, Azure DevOps Server, or GitLab Self-Managed) | Whoever runs it | Confirm it’s reachable over https with a publicly-trusted certificate |
| Claude Code / Codex | The Owner of your Anthropic (Claude Code) organization — admins cannot do this | Paste the telemetry snippet into org-managed settings |
| Cursor | A Cursor team admin | Create a team-level admin API key |
| GitHub Copilot (optional) | A GitHub organization or enterprise admin | Enable the Copilot usage metrics policy, create a classic PAT |
| Devin (optional) | An admin of your Devin organization | Provision a service-user API key and note the Organization ID |
| Jira (optional) | A Jira admin | Create an API token |
| BambooHR (optional) | Someone who sees the whole company’s Who’s Out calendar (usually HR) | Generate the Who’s Out iCal feed URL |
Start your git-provider token request now. In larger orgs, getting approval to create a git-provider token with the right scope can take days — sometimes weeks. It’s the most common bottleneck, so kick it off before anything else.
Only Owners and Admins can connect data. If you open Settings → Data Connections and see a read-only banner, you’ll need an org Owner or Admin to either make the connections or grant you access.
How the Data Connections page works
Every step below happens on the same page: Insights → Settings → Data Connections. It has two parts.
- Connected lists what’s already wired up, with each connection’s data source, connection date, and sync status. Use Status to inspect a connection’s pipelines, Edit to change its credentials or advanced settings, and Disconnect to remove it. The Claude Code & Codex row offers View setup instead of Edit, because its configuration lives in your AI tools rather than in GitKraken.
- Add data source lists everything you can connect. Click the + next to a source to open its connection modal.
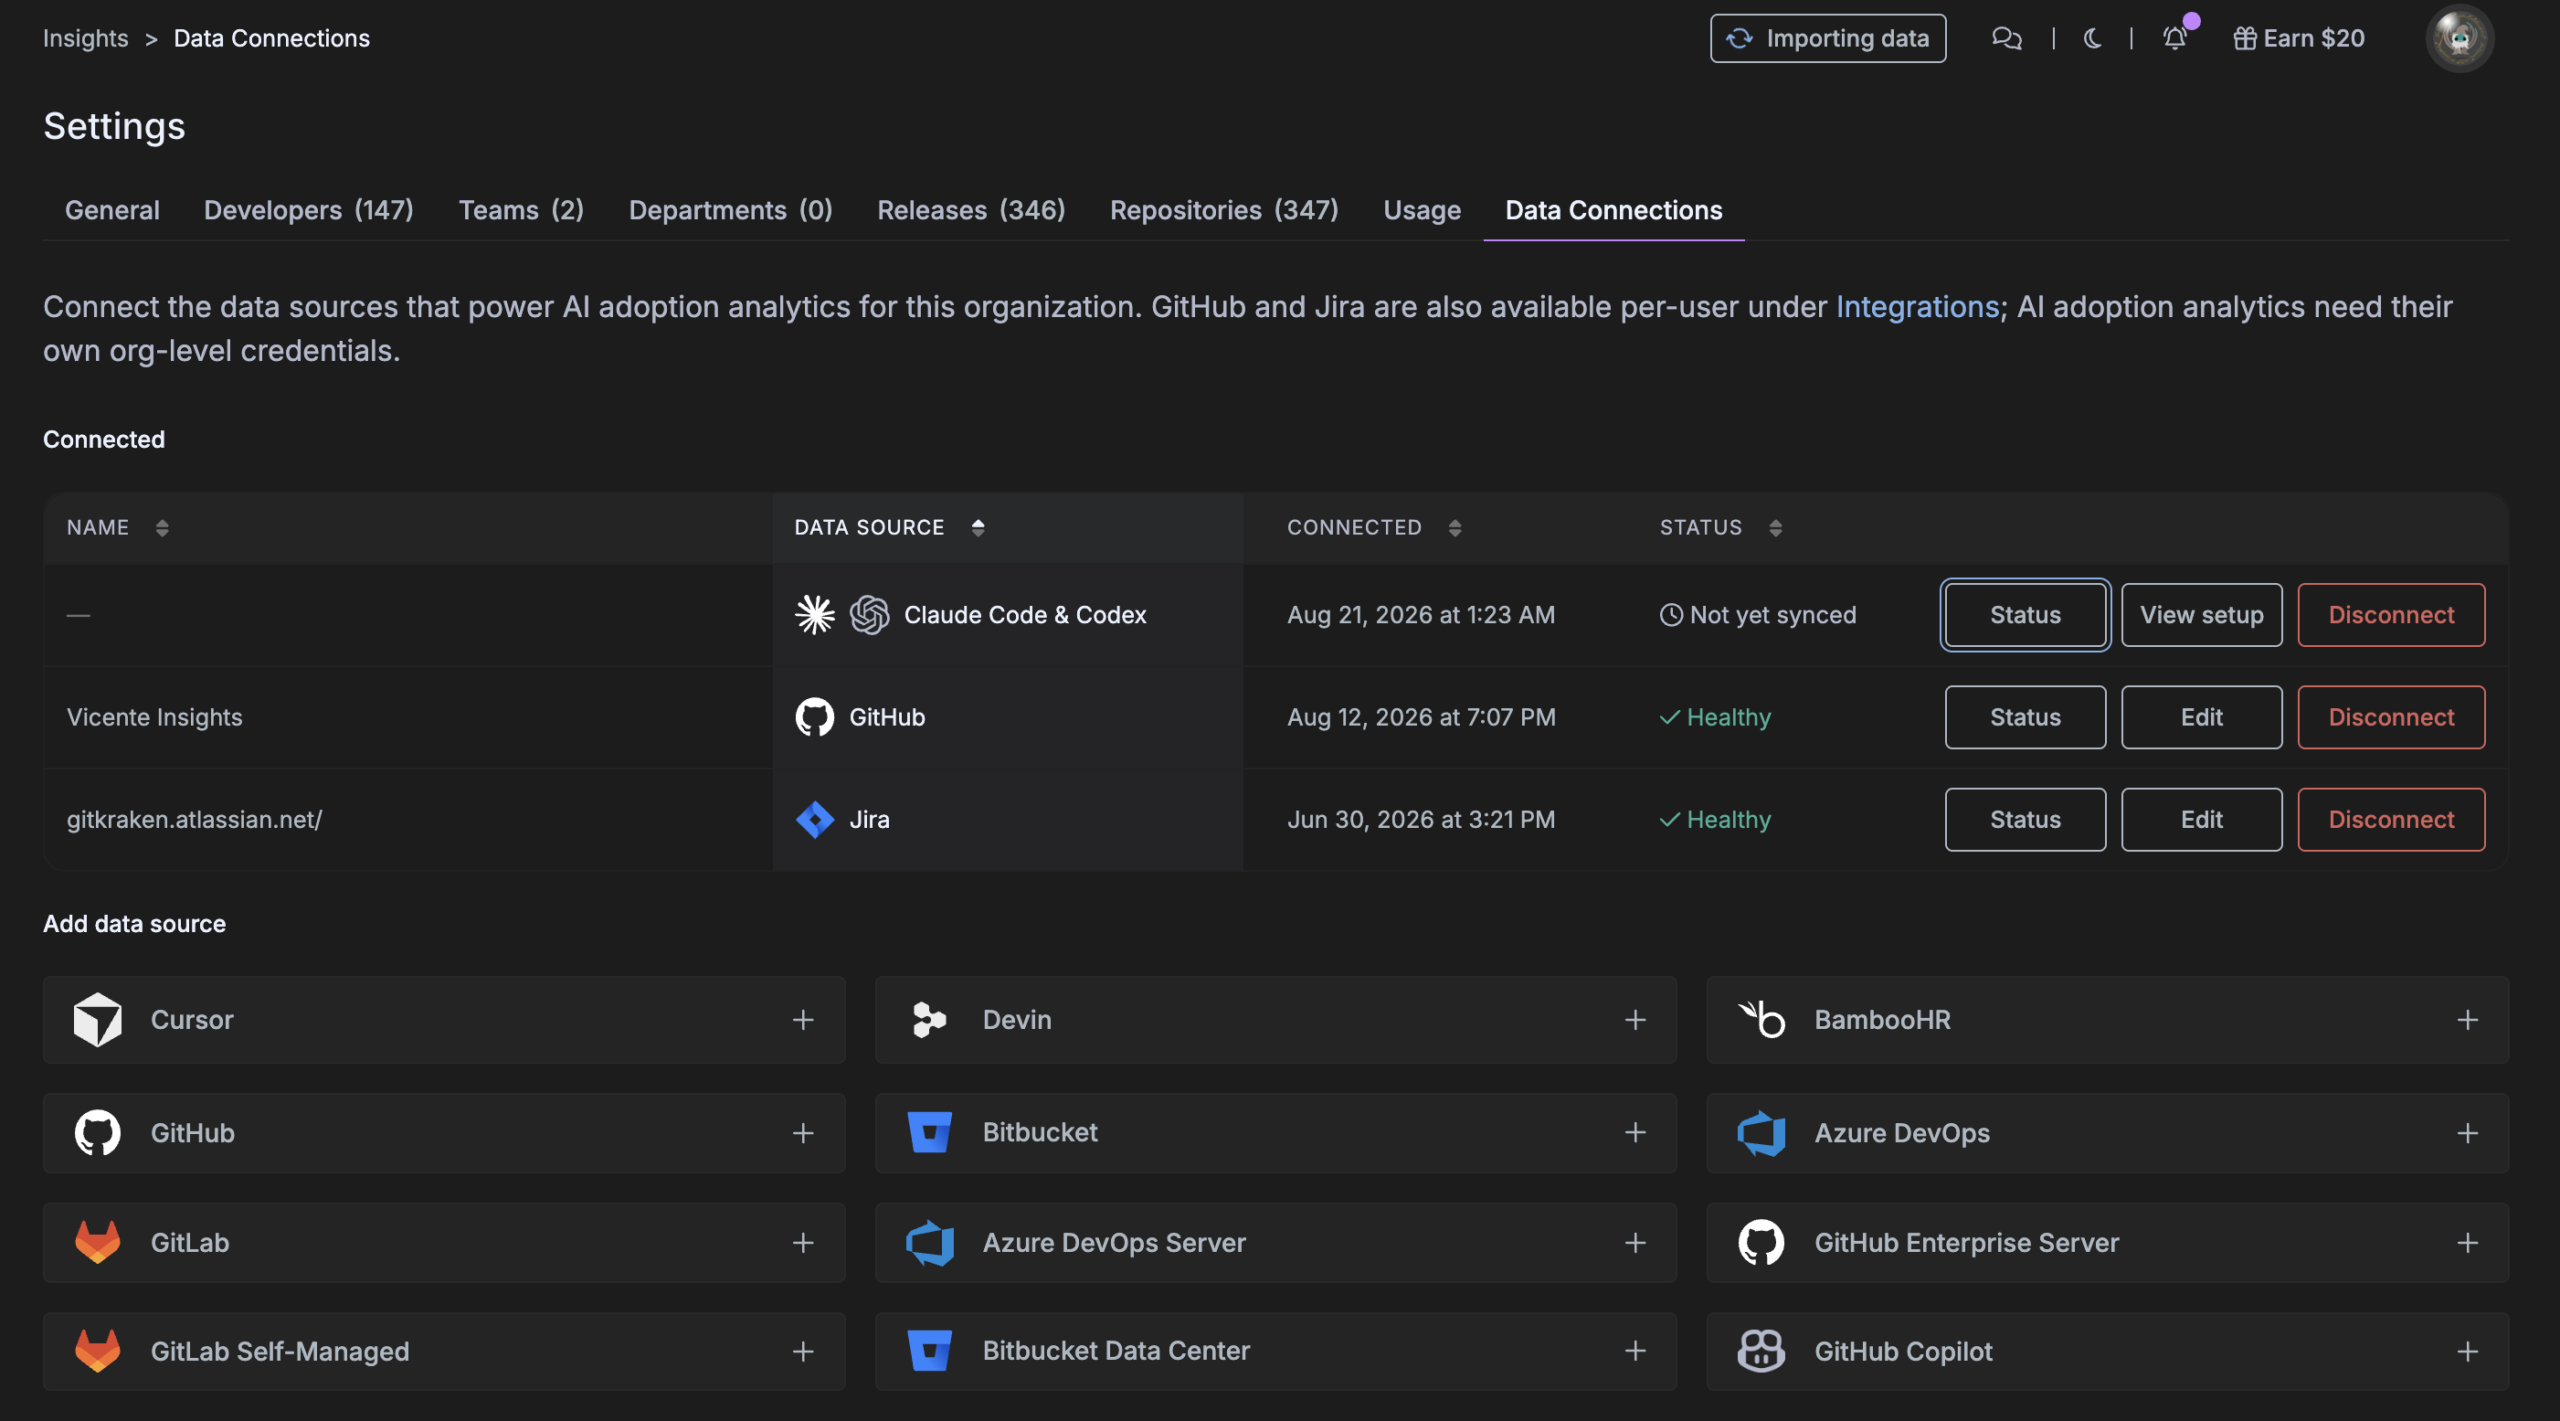
These are org-level credentials. GitHub and Jira are also available per-user under Integrations, but AI adoption analytics need their own org-level connections made here.
Step 1 — Connect your git provider
Your git provider is the foundation. It powers every PR, commit, contributor, and cycle-time metric — without it, the dashboards stay empty. Connect whichever hosts your repositories: GitHub, Bitbucket, Azure DevOps, or GitLab in the cloud, or a self-hosted GitHub Enterprise Server, Bitbucket Data Center, Azure DevOps Server, or GitLab Self-Managed.
GitHub
- In gitkraken.dev, open Insights → Settings → Data Connections.
- Under Add data source, click + next to GitHub.
- In GitHub, create a token (see scopes below), paste it into the field, click Validate, then Connect.
Fine-grained vs. classic token
Either works. The tradeoffs:
| Fine-grained PAT | Classic PAT | |
|---|---|---|
| Org selection | We can’t auto-fetch your orgs — you’ll type the org name in manually | We can list your orgs in a dropdown |
| Best for | Tightly-scoped, single-org setups | Multi-org setups, or excluding specific orgs |
We generally recommend a fine-grained token scoped to your organization.
Required permissions (read-only)
Create the token at GitHub → Settings → Developer settings → Personal access tokens. Set the Resource owner to your organization (not your personal account) so the token can see org repositories.
Fine-grained token — Repository permissions (Read-only):
- Metadata — Read (selected automatically; required)
- Contents — Read
- Pull requests — Read
Recommended — Organization permissions (Read-only):
- Members — Read — lets us match GitHub identities to people on your roster, which makes identity mapping far smoother.
If you use a classic token instead, select the
repo(read) andread:orgscopes.You can edit a token’s scopes after creating it — you don’t need to regenerate it if you missed one. (Note: GitHub does not let you change a token’s expiration after creation, so set a comfortably long expiry up front.)
Once connected, GitHub data begins syncing in the background and continues over the next several hours.
GitHub Enterprise Server
Connect GitHub Enterprise Server to sync activity from a self-hosted GitHub instance.
Requirements:
- The server must be reachable from GitKraken over
httpswith a publicly-trusted certificate. - A personal access token with the
repoandread:orgscopes.
- In Data Connections, click + next to GitHub Enterprise Server.
- Optionally name the connection, then enter the Server URL — for example
https://github.yourcompany.com. - Paste the GitHub Enterprise token and click Validate, then Connect.
Bitbucket
Connect Bitbucket if your repositories live in a Bitbucket workspace. Like GitHub, it powers every PR, commit, contributor, and cycle-time metric.
- In gitkraken.dev, open Insights → Settings → Data Connections.
- Under Add data source, click + next to Bitbucket.
- In the Connect Bitbucket modal, optionally give the connection a Name, then enter your Atlassian account email and a Bitbucket API token (see scopes below).
- Click Validate. Insights lists the workspaces the token can see — select the ones to sync, then click Connect.
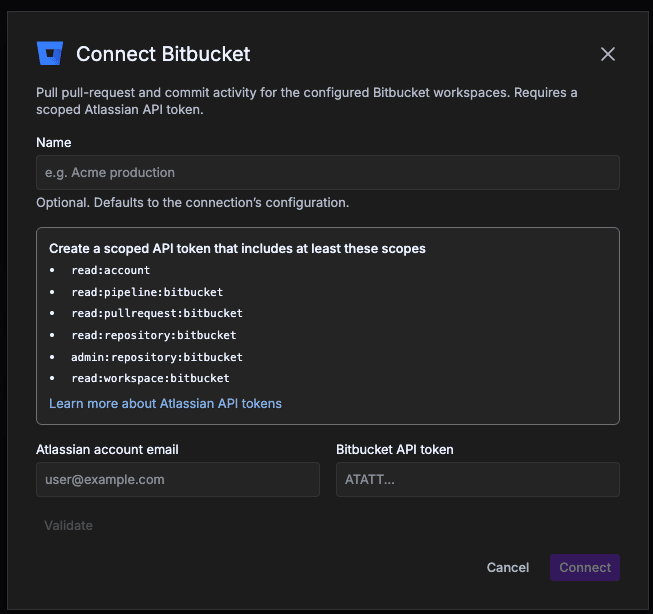
Required token scopes
Bitbucket connects with a scoped Atlassian API token. Create it at id.atlassian.com → Security → API tokens using Create API token with scopes. Name it, set an expiration (Atlassian allows 1–365 days), choose Bitbucket as the app, and include at least these scopes:
read:accountread:pipeline:bitbucketread:pullrequest:bitbucketread:repository:bitbucketadmin:repository:bitbucketread:workspace:bitbucket
Copy the token immediately — Atlassian shows it only once. Scoped Bitbucket tokens start with ATATT….
Tokens expire. When the token reaches its expiration date, syncing stops. Create a new token and update the connection before that happens.
A workspace missing after Validate means the token’s Atlassian account can’t access it. Check that account’s Bitbucket permissions.
Once connected, Bitbucket data begins syncing in the background and continues over the next several hours. Reference: Atlassian — Manage API tokens.
Bitbucket Data Center
Connect Bitbucket Data Center to sync activity from a Bitbucket instance you run yourself.
Requirements:
- The server must be reachable from GitKraken over
httpswith a publicly-trusted certificate. - An HTTP access token with read access to the projects and repositories you want to sync.
- In Data Connections, click + next to Bitbucket Data Center.
- Optionally name the connection, then enter the Server URL — for example
https://bitbucket.yourcompany.com. - Paste the Bitbucket access token and click Validate, then Connect.
As with Bitbucket cloud, the connection only sees the projects and repositories the token’s account can access.
Azure DevOps
Connect Azure DevOps if your repositories live in an Azure DevOps organization. It connects with a Personal Access Token (PAT) scoped to Code (Read).
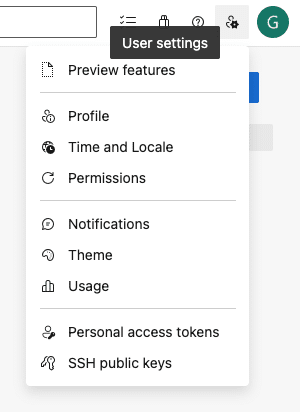
- Sign in at
https://dev.azure.com/{yourOrgName}, open user settings (top right) → Personal access tokens, and select + New Token. Direct link:https://dev.azure.com/{yourOrgName}/_usersSettings/tokens. - Name the token, select the organization it applies to, set an expiration, and select the Code → Read scope. If you don’t see the Code section, click Show all scopes. No other scopes are needed.
- Select Create, then copy the token immediately — Azure DevOps shows it only once.
- In gitkraken.dev, open Insights → Settings → Data Connections and, under Add data source, click + next to Azure DevOps.
- Give the connection a name, enter the Host domain — your organization URL, for example
https://dev.azure.com/yourOrgName— paste the Azure API token, and click Validate. - Optionally narrow what syncs with the project filter or the Repositories to skip list, then click Connect.
Legacy
https://yourOrgName.visualstudio.comURLs are also accepted as the host domain.PATs expire, and org administrators can enforce a maximum lifetime (commonly 90 days). When the PAT expires, syncing stops — create a new one and update the connection.
Microsoft Entra ID organizations: a PAT becomes inactive if its owner doesn’t sign in to Azure DevOps within 90 days. Use an account that logs in regularly.
The connection only sees the projects and repositories the PAT’s account can access. Reference: Microsoft — Use personal access tokens.
Azure DevOps Server
Connect Azure DevOps Server to pull activity from a self-hosted collection.
Requirements:
- Azure DevOps Server 2022 or newer, reachable from GitKraken over
httpswith a publicly-trusted certificate. - A personal access token with Code (Read) — create it the same way as for Azure DevOps above.
- In Data Connections, click + next to Azure DevOps Server.
- Optionally name the connection, then enter the Server URL — for example
https://azuredevops.yourcompany.com. - Enter the Collection —
DefaultCollectionunless your server uses a different one. - Paste the Azure API token and click Validate, then Connect.
GitLab
Connect GitLab to pull activity for your GitLab groups. It connects with a personal access token carrying the read_api scope.
- In Data Connections, click + next to GitLab.
- Optionally name the connection, then create the token — the modal’s Create a token link opens GitLab’s token form for you.
- Paste the GitLab personal access token and click Validate, then Connect.
GitLab personal access tokens start with glpat-…. The connection only sees the groups and projects the token’s account can access.
GitLab Self-Managed
Connect GitLab Self-Managed to sync activity from a GitLab instance you run yourself.
Requirements:
- The server must be reachable from GitKraken over
httpswith a publicly-trusted certificate. - A personal access token with the
read_apiscope.
- In Data Connections, click + next to GitLab Self-Managed.
- Optionally name the connection, then enter the Server URL — for example
https://gitlab.yourcompany.com. - Paste the GitLab personal access token and click Validate, then Connect.
As with GitLab cloud, the connection only sees the groups and projects the token’s account can access.
Step 2 — Connect your AI coding tools
Connect at least one AI provider — this is what lets Insights measure adoption instead of guessing at it. Connect as many as your team uses.
Claude Code and Codex (OpenTelemetry)
Claude Code and Codex both report usage through OpenTelemetry (OTel), and both read their configuration from a snippet GitKraken generates for you.
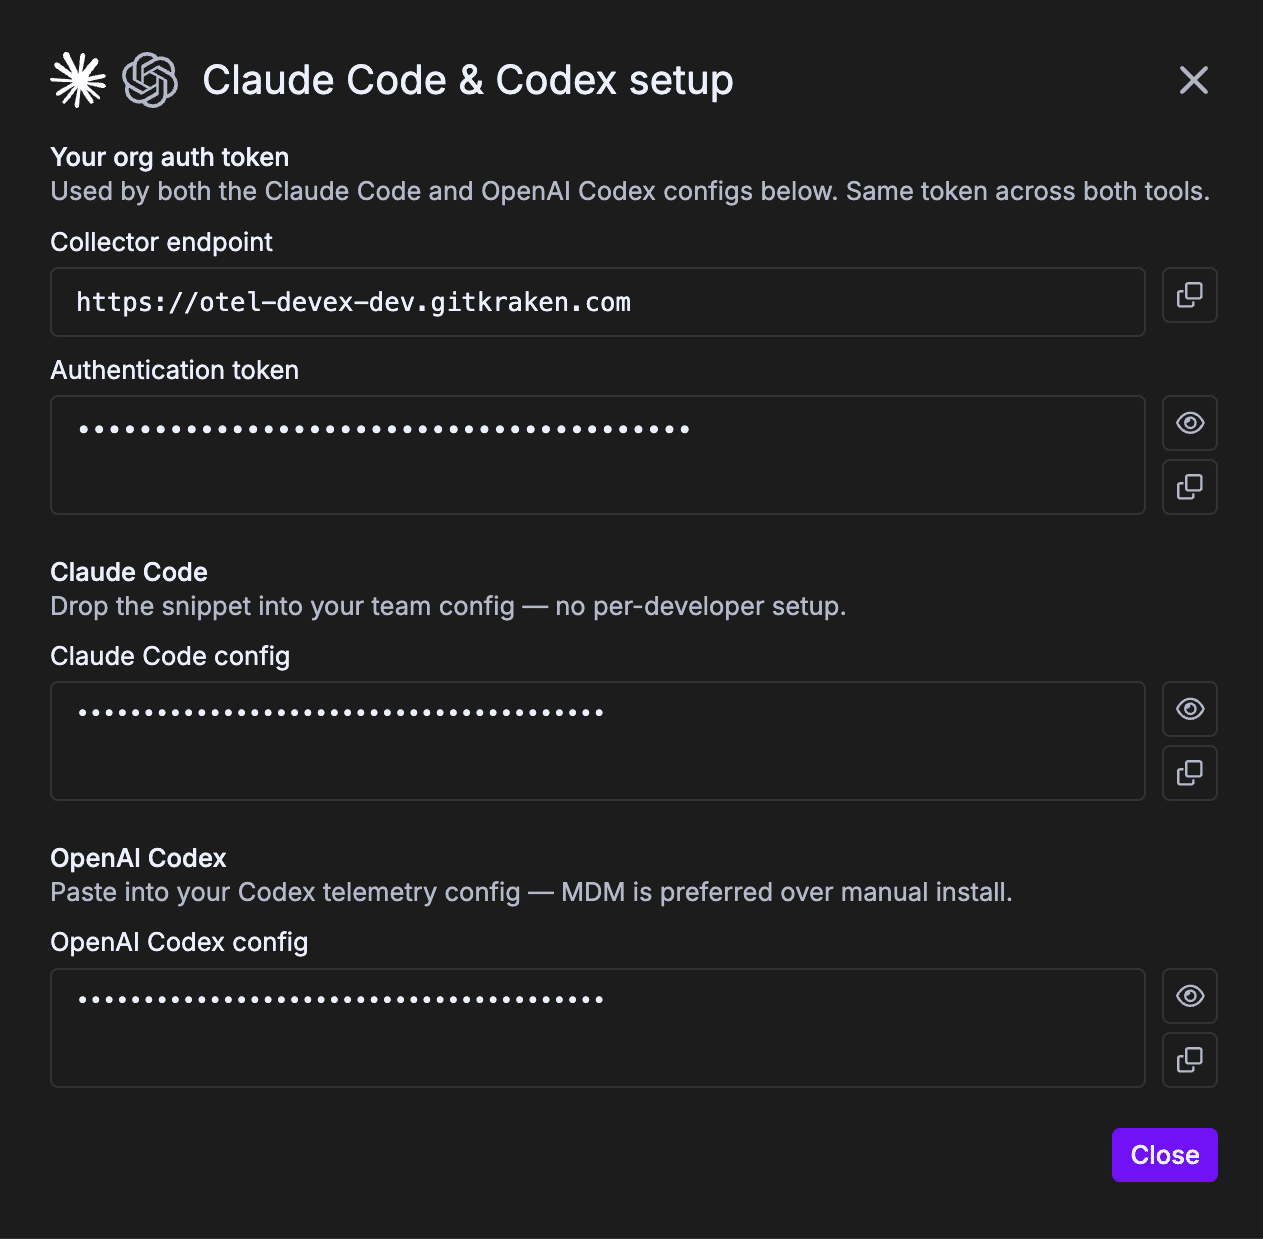
In Data Connections, add a Claude Code & Codex data source, then open View setup on the new connection. That setup page gives you:
- Collector endpoint — the URL telemetry is sent to.
- Authentication token — your organization’s OTel auth token. The same token covers both tools, so if you’ve already connected one, you reuse the credential for the other.
- Claude Code config (JSON) and OpenAI Codex config (TOML) — ready-to-paste snippets with your endpoint and token already filled in.
Always copy the real snippet from the connection page rather than retyping the examples below.
Keep the auth token private. It authenticates telemetry for your whole organization — treat it like any other secret credential.
Data appears on the next fresh session. There’s no backfill — usage starts flowing the next time each developer runs Claude Code or Codex after the settings are applied. (Claude Code OTel instrumentation began March 5, 2026; activity before that date isn’t available.)
Claude Code — organization-managed settings
The recommended rollout is server-managed settings in claude.ai: an Owner pastes the snippet once and every developer’s Claude Code picks it up automatically. This requires a Claude for Teams or Enterprise plan.
- Copy the Claude Code config snippet from the connection page.
- As an organization Owner, go to Admin Settings → Claude Code → Managed settings (claude.ai/admin-settings/claude-code).
- Paste the snippet into the managed settings JSON. If managed settings already exist, merge the
"env"keys into the existing"env"block rather than replacing the configuration — everything here applies org-wide. - Save.
The snippet looks like this, with your own endpoint and token filled in:
{
  "env": {
    "CLAUDE_CODE_ENABLE_TELEMETRY": "1",
    "OTEL_EXPORTER_OTLP_ENDPOINT": "https://otel-devex.gitkraken.com",
    "OTEL_EXPORTER_OTLP_HEADERS": "Authorization=Basic <YOUR_ORG_AUTH_TOKEN>",
    "OTEL_EXPORTER_OTLP_PROTOCOL": "http/protobuf",
    "OTEL_LOGS_EXPORTER": "otlp",
    "OTEL_RESOURCE_ATTRIBUTES": "service.name=claude-code"
  }
}
This requires the Claude Code organization Owner. Admins do not have permission to change org-managed settings. If the Managed settings link redirects you elsewhere, your account doesn’t have the Owner role.
Clients need a restart. Claude Code also polls hourly, but OpenTelemetry configuration specifically takes effect on the next full restart.
Heads-up for your developers — warn them first. The moment org telemetry settings change, Anthropic notifies every developer on their next Claude Code session that organization settings were modified, and the notice uses deliberately cautious wording (it warns that changed settings could run code). Custom environment variables require a one-time security approval, so accepting it is expected and required. This is Anthropic’s standard behavior, not GitKraken’s. Send your team a quick message ahead of time so no one is surprised. Suggested note:
“Heads up — we’re turning on Claude Code usage telemetry for the team so we can measure AI adoption. On your next Claude Code session you’ll see a notice that org settings changed; that’s expected — go ahead and accept it. We are not collecting your prompts.”
Privacy: the default snippet collects usage and session telemetry (tokens used, duration, tool calls) — not prompt content. Anthropic publishes documentation on this telemetry, and there is a separate opt-in flag some orgs add to capture prompts; the snippet we generate does not enable it.
Managed settings take precedence over developers’ own user and project settings, so individual configs can’t accidentally turn the telemetry off.
If your organization already sends Claude Code metrics to another vendor, contact GitKraken support for a combined example.
Alternative — file-based managed settings. Server-managed settings only reach sessions that authenticate through claude.ai (or a direct API key). If your developers run Claude Code through Amazon Bedrock, Google Vertex, Microsoft Foundry, or a custom gateway, deploy the same snippet as a file instead, via MDM or your endpoint manager:
| Platform | Path |
|---|---|
| macOS | /Library/Application Support/ClaudeCode/managed-settings.json |
| Linux / WSL | /etc/claude-code/managed-settings.json |
| Windows | C:Program FilesClaudeCodemanaged-settings.json |
The two mechanisms don’t merge. If the claude.ai managed settings deliver any keys, the on-disk file is ignored entirely for that session. Keep the telemetry config in whichever source your organization actually uses.
Codex — config.toml on each developer’s machine
The Codex CLI reads its settings from a config.toml file in a .codex directory in the user’s home folder:
| Platform | Path |
|---|---|
| macOS | ~/.codex/config.toml |
| Linux | ~/.codex/config.toml |
| Windows | %USERPROFILE%.codexconfig.toml |
Create the directory and file if they don’t exist. If the file already has other settings, append the [otel] block rather than overwriting the file. The snippet is identical on every platform — only the location differs:
[otel]
environment = "prod"

# Logs
exporter = { otlp-http = {
  endpoint = "https://otel-devex.gitkraken.com/v1/logs",
  protocol = "binary",
  headers = { Authorization = "Basic <YOUR_ORG_AUTH_TOKEN>" }
}}
Option A — managed rollout via MDM (recommended for organizations). Because the token is the same for the whole organization, a single managed configuration works for every developer on a given platform:
- Copy the OpenAI Codex config snippet from the connection page.
- Package it as a managed file deployed to the per-user Codex path —
~/.codex/config.tomlon macOS and Linux,%USERPROFILE%.codexconfig.tomlon Windows. Merge it into an existingconfig.tomlif your developers already use one. - Push the profile to your fleet with your MDM tool — Jamf, Kandji, or Intune for macOS; Intune, Group Policy, or your endpoint manager for Windows.
- Confirm the file landed on a sample machine.
Option B — individual developer setup. Any developer can connect their own machine in under a minute.
On macOS or Linux:
mkdir -p ~/.codex
nano ~/.codex/config.toml   # or: open -e ~/.codex/config.toml on macOS
On Windows, in PowerShell:
New-Item -ItemType Directory -Force -Path "$env:USERPROFILE.codex" | Out-Null
notepad "$env:USERPROFILE.codexconfig.toml"
Paste the snippet, then save. New Codex sessions start sending telemetry automatically.
Windows — watch the file extension. In Notepad’s Save dialog, set Save as type to All Files so the file is saved as
config.tomland notconfig.toml.txt.
Cursor (API key)
- In Cursor, go to Settings → API Keys → Create New Key.
- Create a team-level key with admin scope (this grants access to team usage events and the member directory). Name it something recognizable, e.g. “GitKraken Insights.”
- Copy the key immediately — Cursor only shows it once.
- Back in Data Connections, add a Cursor data source, paste the key, and connect.
A personal key, or a key from a non-admin account, won’t have access to team usage data. It must be a team-level admin key.
Devin
Devin usage comes through the Devin API, authenticated with a service-user API key.
- Log in at devin.ai and open your organization’s settings in the top left.
- Go to the Devin API section and click Provision Service User. Provision a user with the Admin role and set an expiration — pick the longest expiry your policy allows, and set a reminder to rotate it.
- Copy the generated token and store it securely. While you’re on this page, note the Organization ID shown at the top.
- In Data Connections, click + next to Devin, give the connection a name, enter the Devin API key and your Devin Organization ID, then click Connect.
Keep the API key private. It grants API access to your Devin organization — treat it like a password.
The key belongs to the provisioned service user rather than a personal account, so it won’t break when an individual teammate leaves. To rotate it, provision a new service-user key in Devin and update the connection.
GitHub Copilot
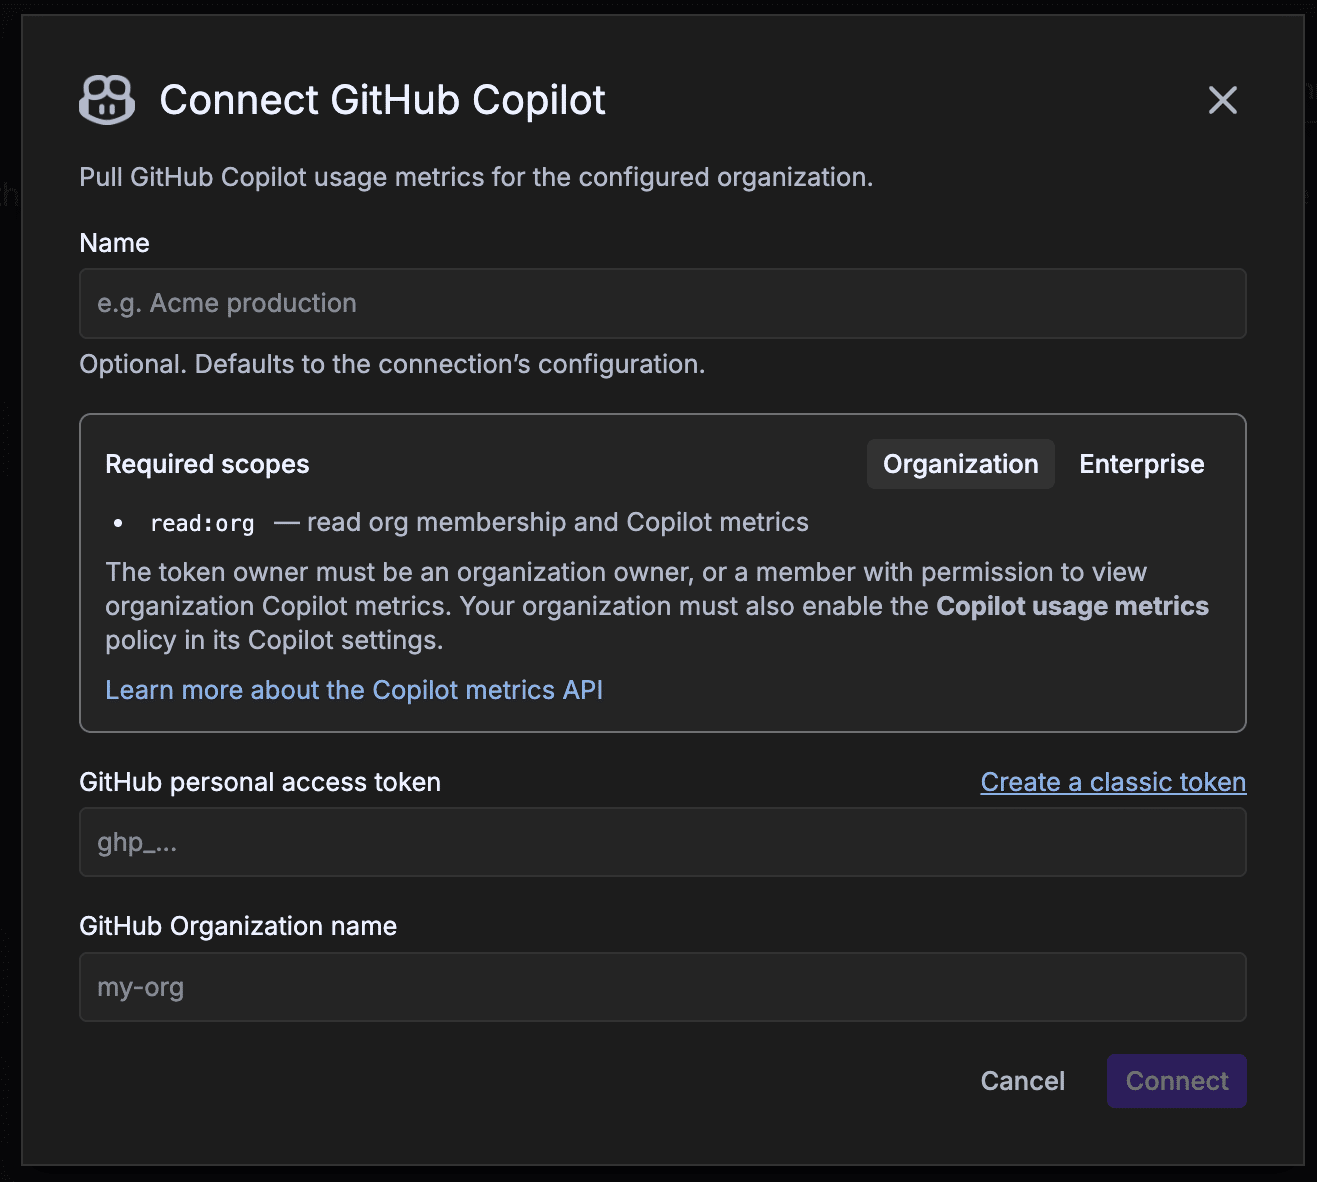
Connect GitHub Copilot to pull Copilot usage metrics for your organization or enterprise. Copilot returns a narrower set of data than Claude Code, Codex, or Cursor, so some metrics will be partial.
You can connect at organization or enterprise level. The connection modal’s Required scopes panel has a tab for each, and your choice changes both the token scope and the last field you fill in:
| Organization | Enterprise | |
|---|---|---|
| Token scope | read:org |
read:enterprise (manage_billing:copilot also works) |
| Token owner must be | An organization owner, or a member with permission to view organization Copilot metrics | An enterprise owner, or a member with permission to view enterprise Copilot metrics |
| Policy enabled on | The organization | The enterprise |
| Last field | GitHub Organization name | GitHub Enterprise slug |
Two prerequisites matter more than the token itself: the Copilot usage metrics policy must be enabled, and the token owner must have permission to view Copilot metrics. Everything else is the same for both levels.
1. Enable the Copilot usage metrics policy (organization or enterprise admin):
- On GitHub, open your organization’s or enterprise’s Settings tab.
- In the left sidebar, select Copilot → Policies.
- Under Features, set Copilot usage metrics to Enabled.
Without this policy, the metrics API returns no data even with a valid token.
2. Create a classic personal access token. The fastest route is the Create a classic token link in the connection modal — it opens GitHub’s token form with the description and the read:org scope already filled in. To do it by hand:
- On GitHub, go to Settings → Developer settings → Personal access tokens → Tokens (classic).
- Select Generate new token → Generate new token (classic), name it in the Note field, and set an Expiration.
- Select the scope for your level —
read:org(underadmin:org) for an organization, orread:enterprisefor an enterprise. Either grants read access to membership and Copilot metrics, and no other scopes are needed. - Click Generate token and copy it immediately — GitHub won’t show it again.
- If your organization uses SAML single sign-on: click Configure SSO next to the token and authorize it for your organization. Without this, the token can’t read org data.
Classic tokens start with ghp_…. Fine-grained tokens are not supported for this connection.
3. Connect in GitKraken:
- In Data Connections, click + next to GitHub Copilot.
- In Required scopes, select the Organization or Enterprise tab to match your token.
- Optionally give the connection a Name, then enter the GitHub personal access token.
- Enter the last field for your level:
- GitHub Organization name — the org slug as it appears in URLs (
my-orgforgithub.com/my-org), not the display name. - GitHub Enterprise slug — your enterprise slug, for example
my-enterprise.
- GitHub Organization name — the org slug as it appears in URLs (
- Click Connect.
GitHub suppresses data for small teams. GitHub only returns Copilot usage for a given day if the team had five or more members with active Copilot licenses on that day, evaluated at the end of the day. Teams below that threshold will see gaps regardless of how the connection is configured.
References: GitHub — REST API endpoints for Copilot metrics and GitHub — Managing your personal access tokens.
Step 3 — Connect Jira and BambooHR (optional)
Neither of these is required to see data, but both sharpen it. You can add them now or any time later.
Jira
Jira gives Insights cycle-time start signals and customer-bug data, so AI Impact compares like-for-like work across tools.
- Go to id.atlassian.com → Security → API tokens.
- Click Create API token — not “Create API token with scopes.”
- In Data Connections, click + next to Jira and enter:
- the API token,
- the account email the token was created for,
- your Jira instance URL.
Scoped tokens aren’t supported yet. Jira’s newer “API token with scopes” option won’t work — use the plain Create API token option. (The Atlassian token page is easy to miss; the link above goes straight to it.)
Configure Change Failure Rate (CFR)
What is CFR? Change Failure Rate is the DORA stability metric — the percentage of your releases that produce a customer-reported bug. Setting it up is what powers the CFR cards on /ai-adoption/ai-impact, board-metrics, and executive. (See the Change Failure Rate (CFR) metric page for how to read it.)
CFR needs two pieces of configuration. Until both are set, those cards show zeros even when Jira is connected and healthy.
1. Point Insights at your Jira “customer bug” field.
Where the setting is: Insights → Settings → Data Connections → the Jira connection → Edit → expand the Advanced section → Customer bug field ID.
Set it to the custom Jira field your team uses to flag customer-reported defects — for example customfield_10042. If you have more than one Jira instance, set it on each one.
You can keep more than one CFR configuration. Set up a separate Change Failure Rate configuration for each Jira instance you run, or for each definition of a failed change your org uses.
[Screenshot needed: Jira connection modal → Advanced → “Customer bug field ID” field.]
Finding the field ID: In Jira, go to Settings → Issues → Custom fields, locate your “Customer Bug” field, and open ⋯ → Edit details — the ID appears as
customfield_NNNNNin the page URL. Admins can also list every field athttps://<your-site>.atlassian.net/rest/api/3/fieldand match by name.This is the most common reason CFR shows zeros. If the field ID is blank, no Jira issues are attributed as customer bugs, so CFR can’t be calculated — even with Jira fully connected.
2. Make sure releases are being tracked. CFR is failing releases ÷ total releases, so Insights needs to know what counts as a release. Go to Settings → Releases and set the Signal for each repository:
- Auto-detect (default) — tries GitHub Releases first, then falls back to your CD workflow.
- GitHub Releases — use the GitHub Releases API explicitly.
- Workflow file — watch a specific GitHub Actions workflow (e.g.
cd.yaml). - Skip — don’t track releases for that repo.
Once syncing completes, confirm the # Releases column shows a non-zero count.
Push releases from your own tooling. If your deployments don’t produce a signal Insights can detect — an external CI/CD system, a platform GitKraken doesn’t read, or a pipeline that doesn’t tag releases — you can send releases to Insights yourself with the Manual Releases API. Create an API key in the Security tab of your gitkraken.dev account, then POST each release. Manual releases are tracked alongside detected ones, and you can backfill historical releases the same way.
What counts as a failure: a customer bug (matching the field above) at High or Highest / Critical priority that’s attributed to a release. Severity comes directly from the Jira priority field, so keep priorities consistent.
Verify it’s working: on the Jira connection, open Status and confirm the Change Failure Rate pipeline is healthy. Then check the CFR card on /ai-adoption/ai-impact — it should read N bugs / M releases rather than “Not configured.”
CFR is a lagging metric and syncs hourly. New customer bugs take time to appear, and a bug reported weeks after a release lands in the week it’s reported — not the week it shipped.
BambooHR
BambooHR syncs your team’s paid time off so analytics exclude vacation days. Insights reads it from BambooHR’s Who’s Out iCal feed — a read-only calendar URL. No API key is involved: the feed URL itself is the credential.
- Log in to BambooHR (
https://yourcompany.bamboohr.com) with an account that can see the whole company’s Who’s Out calendar. - On the Home page, find the Who’s Out widget and click Full Calendar.
- In the calendar view, open the action menu (gears) in the top-right corner and select iCal Feeds.
- Copy the feed URL — it looks like
https://yourcompany.bamboohr.com/feeds/ical/.... - In Data Connections, click + next to BambooHR, optionally name the connection, and paste the URL into BambooHR Who’s Out iCal URL. The URL must use
https. - Click Connect. GitKraken fetches the URL and verifies it serves a live iCalendar feed before saving.
Generate the feed with an account that sees everyone. A feed only contains what its generating user can see in their own Who’s Out widget — typically that means an HR admin or someone with company-wide calendar visibility. Otherwise part of the team’s PTO will be missing.
Treat the feed URL as a secret. BambooHR iCal feeds are not password protected — anyone with the URL can read the calendar, and the embedded token is the only protection.
Any user can reset or delete their feed URL in BambooHR at any time, which invalidates it and stops the sync. If that happens, generate a new feed and update the connection.
BambooHR notes that changes can take up to 24 hours to appear in external calendar feeds, so very recent PTO entries may lag. If you don’t see the iCal Feeds option at all, your BambooHR administrator controls that access — ask them to enable it or generate the feed for you. Reference: BambooHR — Create an iCalendar Feed.
Once connected, time off feeds into the metrics described in For admins.
Step 4 — Set your benchmarks
A few business inputs let Insights translate engineering activity into ROI and tier your developers correctly. Sensible defaults are pre-filled — confirm or adjust in Settings → General:
- Developer Hourly Rate — used for ROI / time-saved-to-dollars on AI Impact.
- Baseline Period — the “before” date AI-adoption lift is measured against.
- Maturity Factor (Company AI Readiness %) — an org-wide scaling knob; the 0.75 default suits most orgs.
- Default Department — pre-selects the right view for first-time visitors.
You can change all of these at any time. For what each setting affects, see the AI Adoption Settings reference.
Step 5 — Map developer identities
This is the step that makes or breaks clean data. The same person often shows up under several identities — a git-provider login, one or more commit emails, a Jira account. Until those are merged, your leaderboards and adoption metrics double-count, and you end up with “parallel universes” of the same developer.
- After your git provider has been processing for a bit (allow ~12 hours), open Settings → Developers.
- Review the detected identities. Where you recognize duplicates of the same person, use Merge to combine them — including two accounts on the same git provider, such as a developer with two GitHub logins.
- Where an identity is missing an email, add it — this helps tie commit data back to the right person.
Insights auto-suggests matches using email, git handle, and name, but you should confirm them and clean up anything it couldn’t resolve. Treat this like an inbox and keep it empty — see the For admins page for ongoing roster hygiene.
Excluding review bots
AI code-review bots — such as GitHub Copilot review or Atlassian Rovo — leave activity on pull requests, so Insights detects them as contributors. If you’d rather they not appear as developers in your metrics, you can exclude them from the roster in Settings → Developers. Excluded developers also stay out of the developer dropdowns across the dashboards.
Step 6 — Invite your team
Give the rest of your stakeholders access so they can read the dashboards.
- From the gk.dev sidebar, go back to the main menu and open Users.
- Click Add users and invite people by email, or share the invite link.
- Give each person at least an Admin or Lead role so they can view Insights.
If you invite by link: new users land with a default role, so you’ll need to adjust their role to Admin or Lead after they create their account.
What to expect after setup
- First data: the last month of git-provider activity typically appears within a few hours; a full year usually lands within one to two days.
- AI tool data: starts flowing on each developer’s next Claude Code / Codex / Cursor session — there’s no backfill before the connection was made. Devin data arrives through its API once the connection is live.
- Time off: BambooHR changes can take up to 24 hours to reach the iCal feed, so recent PTO may lag.
- Sync status: each connection on the Data Connections page shows a health status. If a connection looks degraded or errored, that’s the first place to check — and let your account team know.
- A degraded status during the first sync is usually normal. Large organizations hit their git provider’s API rate limits while the initial backfill pulls a year of history, and the connection reports degraded while it waits. The credentials are fine and the data is still coming. Contact your account team before disconnecting and reconnecting.
Troubleshooting setup
| Symptom | What’s happening | Fix |
|---|---|---|
| Read-only banner on Data Connections or Settings | Your gk.dev role can’t manage connections | Ask an org Owner or Admin to connect, or to grant you access |
| GitHub token validates, then “Connect” won’t enable | Occasional UI hiccup where re-validating clears the token | Refresh the browser, paste the token once, then Validate → Connect |
| No orgs to select after connecting GitHub | Expected with a fine-grained token — we can’t auto-fetch orgs | Type your GitHub org name in manually |
| A Bitbucket workspace or Azure DevOps project is missing after Validate | The token’s account can’t access it | Check that account’s permissions in Bitbucket or Azure DevOps |
| A self-hosted server won’t validate | GitKraken can’t reach it, or its certificate isn’t publicly trusted | Confirm the Server URL is reachable over https from outside your network with a publicly-trusted certificate — self-signed and internal CAs won’t work. Azure DevOps Server must also be 2022 or newer |
| Azure DevOps sync stopped | The PAT expired, or (Entra ID orgs) its owner hasn’t signed in for 90 days | Create a new PAT with Code (Read) and use an account that logs in regularly |
| Can’t create the Cursor key / no usage data | Key isn’t team-level admin, or your Cursor role is too low | Have a Cursor team admin create a team-level admin key |
| Can’t change Claude Code org settings | You’re an admin, not the org Owner | Only the Anthropic org Owner can apply the telemetry snippet |
| Claude Code settings applied but no telemetry | Clients pick up OTel config on a full restart; or an on-disk managed-settings.json is being ignored |
Have developers restart Claude Code — and keep the config in one source, since claude.ai managed settings override the file entirely |
| No Codex telemetry | The snippet is in the wrong path, Notepad saved it as config.toml.txt, or the developer is running a pre-release build of the Codex desktop app |
Verify the per-OS config.toml path and the file extension, and have developers run a stable Codex build — pre-release and alpha builds can drop OTel events |
| A connection shows “degraded” during the first sync | Usually your git provider’s API rate limits throttling the initial backfill, not a broken connection | Let it finish. If it doesn’t clear, contact your account team before disconnecting and reconnecting |
| A connection sits at “Not yet synced” | Expected right after connecting — and for Claude Code / Codex it stays that way until the first developer session sends telemetry | Wait for the first sync; for Claude Code / Codex, confirm the snippet is applied and have someone start a fresh session |
| Copilot connects but no metrics appear | The Copilot usage metrics policy is off, the token owner can’t view Copilot metrics, or the team had fewer than five active Copilot licenses | Enable the policy in org Settings → Copilot → Policies, use an org owner or a role with View Organization Copilot Metrics, and check the license count |
| Copilot token rejected | A fine-grained token was used, or SAML SSO isn’t authorized | Create a classic token with read:org, then Configure SSO on it |
| Jira token rejected | A scoped token was created | Recreate with plain Create API token (no scopes) |
| BambooHR feed fails to validate, or some people’s PTO is missing | The feed was reset/deleted, or it was generated by an account with narrow calendar visibility | Regenerate the feed with an account that sees the whole company, and update the connection |
| CFR cards show zeros or “Not configured” | The Customer bug field ID isn’t set, or no releases are tracked | Set Customer bug field ID on the Jira connection (Advanced), and set a release Signal per repo in Settings → Releases — see Configure CFR |
| A developer appears twice | Multiple identities not yet merged | Merge them in Settings → Developers (Step 5) |
| Setup email flagged by your IT as suspicious | Some corporate filters flag new domains | Navigate directly to gitkraken.dev instead of clicking the email link; tell your account team |
If a problem persists, contact your GitKraken account team with the page URL, what you were connecting, and a screenshot of any error.
Related pages
- Getting Started with AI Adoption — orient yourself in the dashboards once data is flowing.
- For admins — ongoing roster hygiene, data freshness, and troubleshooting.
- Manual Releases API — push releases to Insights from deployment tooling it can’t read.
- AI Adoption Settings reference — what each setting changes.
- Getting Started with GitKraken Insights — request access and the classic repository connection flow.
