
Last updated: June 2026
This family answers a single question: how much is your team actually using AI, and how deeply?
It’s the most-read group of metrics in the dashboard because it surfaces the rollout story — are people picking up the tools, are they integrating them, and where are the gaps?
The metrics
| Metric | What it captures |
|---|---|
| Agent Adoption Score | 0–100 per developer. Combines daily consistency, hourly spread, prompt volume, and token output across Claude Code and Codex, with optional Cursor boost. The headline number on /ai-adoption/developers. |
| Agent Autonomy Score | 0–100 per developer. Measures depth of autonomous AI use — sessions with 10+ tool calls across Claude Code and Codex (Cursor not included). Separates “asking AI a question” from “letting AI do real work.” |
| AI Tier | Power User / Regular / Explorer / Emerging / On PTO. The composite category. Computed by weighting Adoption, Agentic, and Output Norm together (defaults 0.5 / 0.2 / 0.3). |
| Maturity Factor | 0.01–1.00 org-wide ceiling knob (default 0.75). Adjusts all P90 scores so the tier ceiling fits your org’s actual maturity. |
| Cursor Boost | 25% by default. How much Cursor adoption layers on top of Claude / Codex in the headline Adoption Score. |
How the metrics fit together
Adoption Score is built from per-provider scoring (Claude, Codex, Cursor) using a four-factor blend:
- Daily Use — consistency across the window
- Hourly Spread — diversity within days
- Prompts — volume of interactions
- Output — token production depth
Claude Code and Codex events are unioned at the factor level (days, hours, prompts, tokens merged together — not averaged) and scored as one primary score. Cursor is scored independently and added as a secondary boost (default 25% of the Cursor score).
Then everything scales by Maturity Factor, which is your org-wide ceiling knob.
Primary score   = blend(Claude ∪ Codex)
Final headline  = min(Primary + 0.25 × Cursor, 100) × Maturity Factor
Agentic is a separate, parallel measurement that runs against Claude Code and Codex sessions only — Cursor doesn’t currently feed Autonomy because Cursor’s event stream doesn’t expose per-session tool calls in a way we can score. Agentic does not roll into Adoption. Both feed into the AI Tier composite alongside Output Norm.
Tier composite (default; org-configurable)
tierScore = (0.5 × Agent Adoption) + (0.2 × Agent Autonomy) + (0.3 × Output Norm)Each weight is read from analytics.app_settings per organization (keys: tier_weight_adoption, tier_weight_agentic, tier_weight_output) and renormalized to sum to 1.0. The tier-badge tooltip in the app renders the live values for every developer so the breakdown is always transparent.
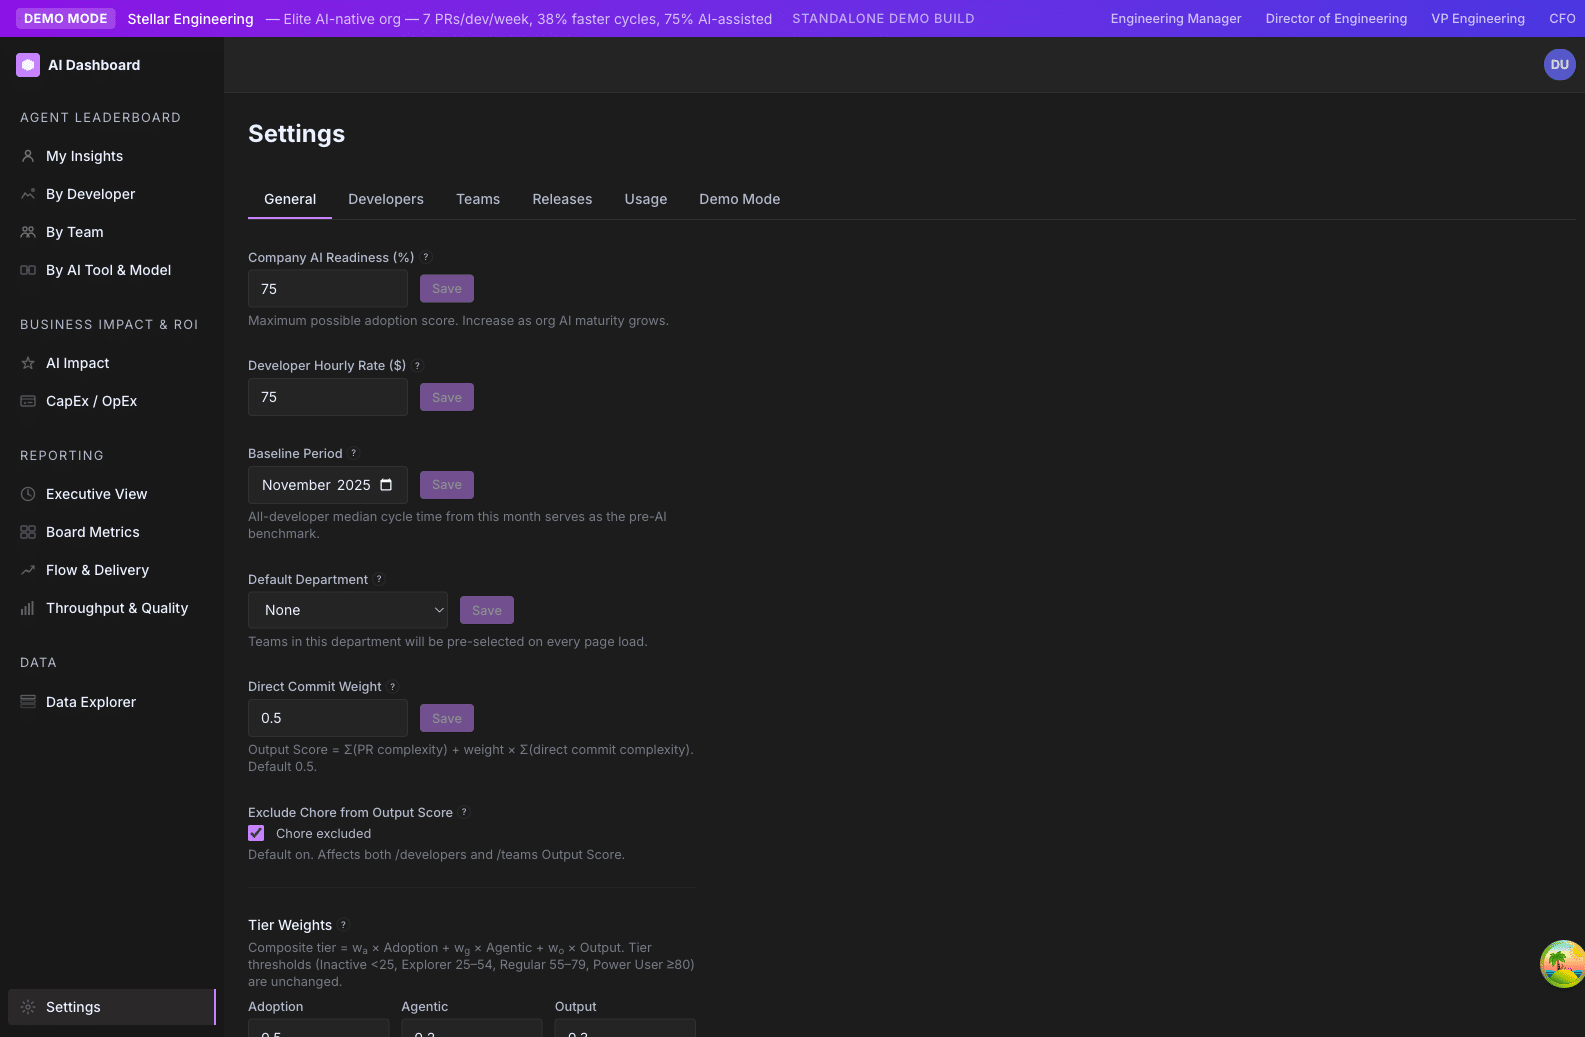
What admins can change in Settings → General: Maturity Factor, Developer Hourly Rate, Baseline Period, and Default Department, plus the tier composite weights (tier_weight_*) and the Output Score sub-weights (direct_commit_weight, review_weight, output_score_exclude_chore). All are per-org settings stored in app_settings and editable directly in the settings form.
Read this family responsibly
Three things to remember:
- The Adoption Score is about behavior, not skill. A developer can be brilliant and Emerging (their work this quarter doesn’t suit AI). The score is descriptive, not evaluative.
- Org P90 is the ceiling, not 100. Because we normalize against the org’s 90th percentile, a single developer can’t game the system by spamming prompts. The ceiling moves with the org.
- Maturity Factor sets the headroom. At 0.75, even a perfect (P90) developer scores 75. That’s intentional — it leaves room for the org to grow into higher numbers without retiering everyone overnight.
See How to think about developer scores before drawing individual conclusions.
Where this family shows up
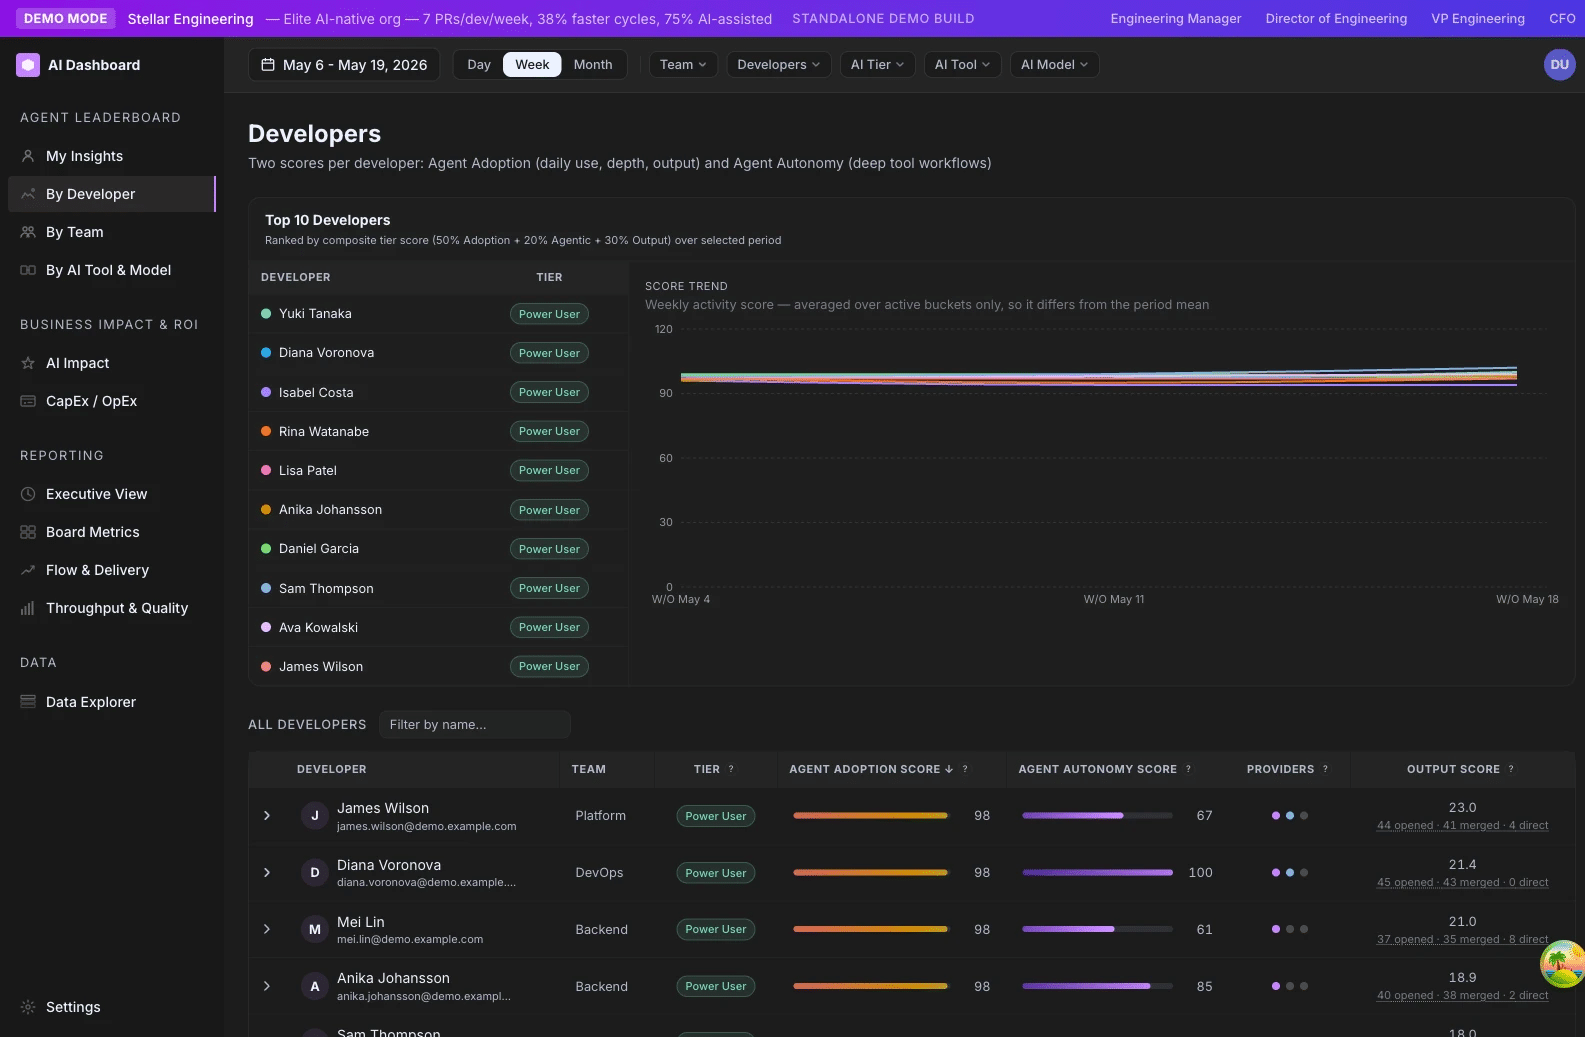
- /ai-adoption/developers — primary surface. Each row has Adoption, Agentic, Tier, and a heatmap.
- /ai-adoption/teams — team averages and tier mix bars.
- /ai-adoption/ai-tools-comparison — cohort comparisons (e.g. team A vs. team B, or Claude vs. Codex users).
- /ai-adoption/executive — hero KPI (“AI Adoption %”) and trend lines.
- /ai-adoption/ai-impact — autonomy deep dive and Business Impact / ROI.
- Adjacent surfaces in the same nav family: /ai-adoption/board-metrics, /ai-adoption/capex, /ai-adoption/data-connections, /ai-adoption/data-explorer, /ai-adoption/settings/*.
Agent Adoption Score
A 0–100 measure of how consistently and how deeply a developer is using AI coding tools (Claude Code, Codex, Cursor) over the selected window.
Family: Adoption & Agentic · Cadence: Window-based (refreshes with date range) · Where it appears: /developers, /teams, /comparison, /executive, /ai-impact
At a glance
The Agent Adoption Score is the dashboard’s headline answer to “is this developer using AI?” It’s a single number from 0 to 100 that combines four dimensions of usage — daily consistency, time-of-day spread, prompt volume, and output tokens — across all the AI tools the developer has access to. Higher means more consistent, deeper use; lower means sporadic or shallow use. It’s normalized against your organization’s own 90th-percentile usage, so the bar is your team, not some industry average.
Formula
Adoption Score = min(Primary + 0.25 × Cursor, 100) × Maturity Factor

  where Primary = four-factor blend of Claude ∪ Codex
        Cursor  = four-factor blend of Cursor (added if non-null)
The four factors per provider, each capped at the org’s P90 and weighted into the 100-point scale, are:
- Daily Use — weekdays with ≥1 event / effective weekdays
- Hourly Spread — avg distinct hours per day with ≥2 prompts / org P90 spread
- Prompts — prompts per weekday / org P90 prompts
- Output Tokens — output tokens per weekday / org P90 tokens
How GitKraken Insights calculates it
Step 1 — Per-provider scoring. For each provider (Claude Code, Codex, Cursor), we compute four normalized factors:
- Daily Use: the fraction of effective weekdays in the window where the developer had at least one AI event. Effective weekdays subtracts weekdays before the provider was instrumented (Claude Code data starts March 5, 2026) and subtracts PTO weekdays.
- Hourly Spread: the average number of distinct hours per active weekday where the developer ran ≥2 prompts. Captures “AI is integrated into their workday” vs. “AI is one batch at the end of the day.”
- Prompts: total prompts divided by active weekdays.
- Output Tokens: total output tokens divided by active weekdays. A proxy for the depth of each AI interaction.
Each factor is divided by the corresponding org P90 cap (the 90th-percentile value across all active developers in the window) and capped at 1.0. So a developer at the org’s 90th percentile or above on a factor scores the max contribution for that factor.
The four normalized factors are then weighted (DailyUse, HourlySpread, Prompts, Output) and summed to a 0–100 provider score.
Step 2 — Union Claude + Codex into the Primary score. We don’t average the two providers — we union their events at the factor level. A developer using Claude in the morning and Codex in the afternoon gets credit for the combined daily spread, not two separate fractional scores. This avoids penalizing devs who use multiple tools.
Step 3 — Add the Cursor boost. If the developer has Cursor data, we compute their Cursor score independently and add it to the Primary at a 25% rate (configurable via the SCORE_SECONDARY_BOOST env var). The total is capped at 100 before maturity scaling.
Step 4 — Scale by Maturity Factor. The final value is multiplied by the org’s Maturity Factor (default 0.75). At the default setting, a developer at the org’s P90 on every factor scores 75 — leaving headroom to grow into the Power User band (≥80).
Window scope. Everything is scoped to the date range selected at the top of the page. The org P90 caps are recomputed for the same window, so the ceiling moves with the cohort.
Why it matters
Adoption is the leading indicator of an AI rollout. Output follows adoption with a 4–12 week lag — first developers have to integrate the tool, then they have to get good at it, then they ship faster. Reading the Adoption Score in isolation tells you whether your rollout is moving. Reading it alongside Output Score over time tells you whether the rollout is paying off.
The score is descriptive, not evaluative. A senior developer working on a quarter-long migration may show as Emerging because the work doesn’t suit AI tooling. A junior on UI changes may be a Power User. Neither is a judgment of skill. The aggregated score across a team or a cohort is the more useful read.
How to read it
| Range | Read it as |
|---|---|
| 80–100 | Power User — AI is integrated into daily work, used across multiple sessions per day |
| 55–79 | Regular — solid, consistent adoption; AI is a routine part of their workflow |
| 25–54 | Explorer — using AI but not yet daily, or shallow integration |
| 0–24 | Emerging — minimal or no AI usage in the window |
These tier bands are fixed reference points — they do not move with the Maturity Factor. What moves is the score: the Maturity Factor sets the ceiling (Maturity Factor × 100), so at the default 0.75 the highest achievable score is 75 — the top of Regular — and the Power User band (≥ 80) only opens up as you raise the Maturity Factor toward 1.0. See Maturity Factor for how to size it.
A team average of 50–65 means a healthy mix with most developers in Explorer/Regular. At the default 0.75 Maturity Factor, a team average approaching the 75 ceiling means broad, deep adoption across the team — you raise the Maturity Factor before the Power User band fills in. A team average below 30 is your “rollout has stalled” signal.
Where it appears
- /developers — primary surface. Headline column on the developer table, plus an expanded panel showing the four-factor breakdown and the per-provider contribution (Claude vs. Codex vs. Cursor).
- /teams — team average column on the main table; expandable rows show per-developer scores.
- /comparison — distribution by cohort (e.g. by team, by AI tool, by primary model).
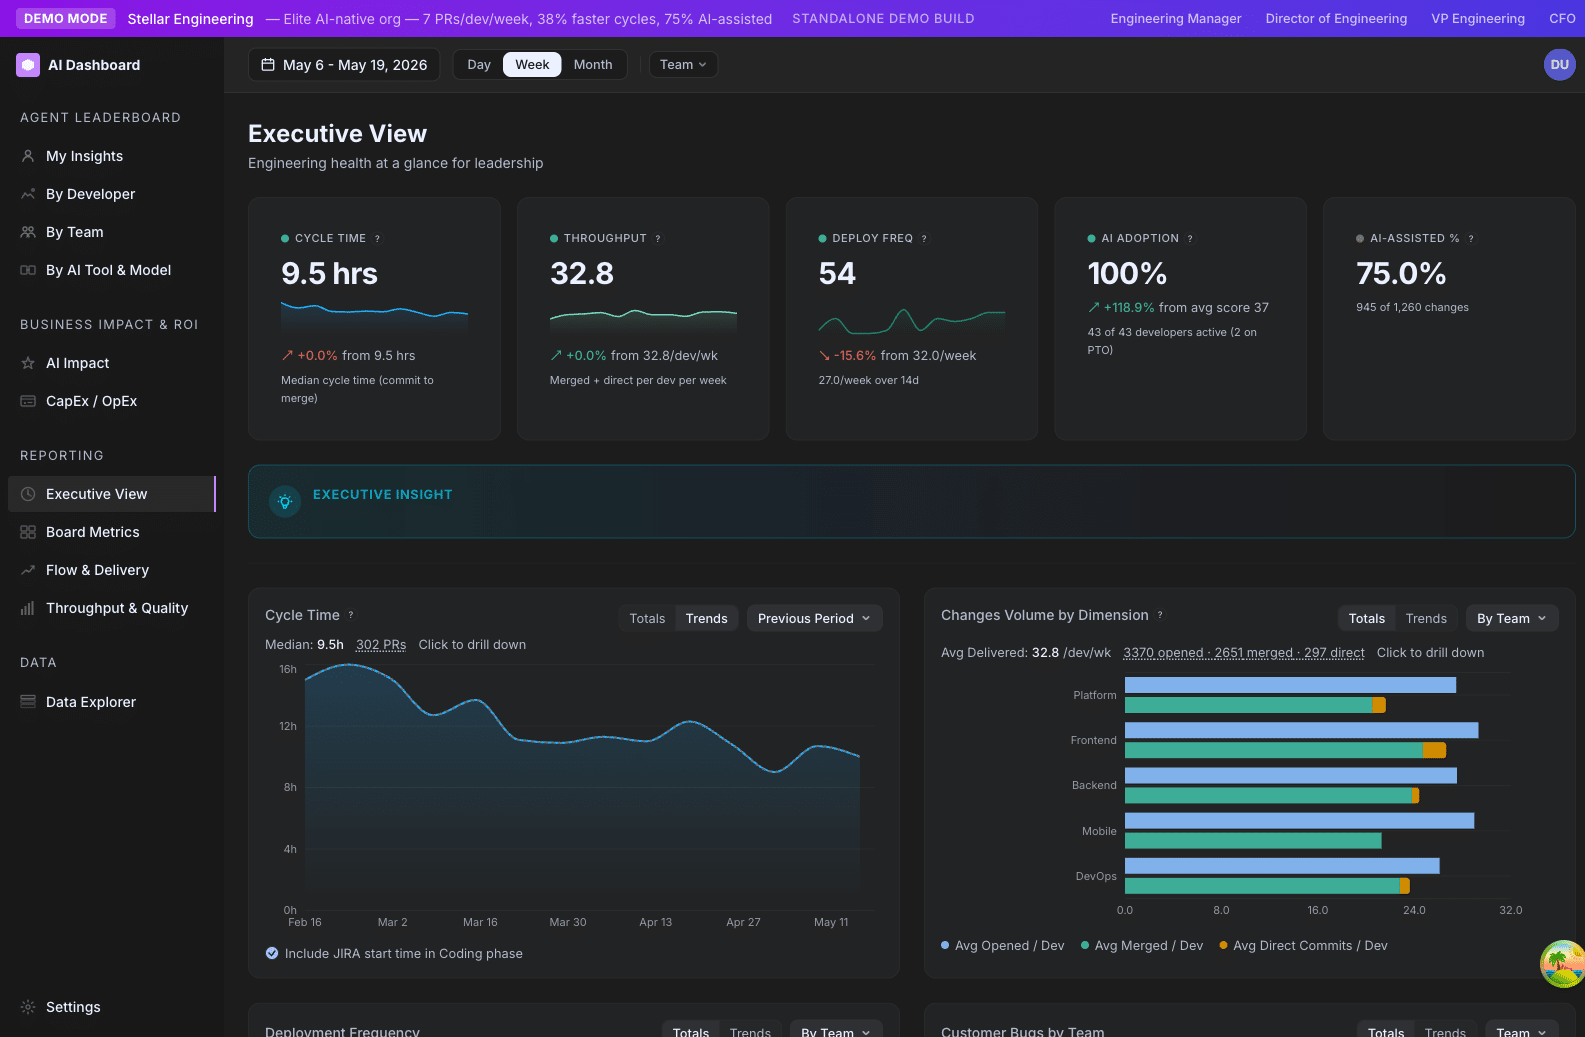
- /executive — hero KPI card “AI Adoption %” (percentage of devs at score ≥ 25) and a trend line.
- /ai-impact — used as the cohort dimension for the productivity uplift analysis.
Settings that affect it
- Maturity Factor — multiplies the final score. Lowering it lowers the tier ceiling for everyone.
- Cursor secondary boost (env var
SCORE_SECONDARY_BOOST, default 0.25) — how heavily Cursor contributes alongside Claude / Codex. - Provider weights (env vars
SCORE_WEIGHT_*) — how much DailyUse / HourlySpread / Prompts / Output each contribute within a provider’s score.
The four-factor weighting per provider is not currently exposed in the Settings UI. Ask your account manager if you need it tunable.
Related metrics
| Metric | Relationship |
|---|---|
| Agent Autonomy Score | Parallel metric. Adoption captures consistency; Autonomy captures depth of autonomous use. |
| AI Tier | Adoption is one of three inputs into the composite Tier. |
| Maturity Factor | The scalar that ceilings every Adoption Score in your org. |
| Cursor Boost | Defines how Cursor adoption contributes to the headline Adoption Score. |
| Output Score | The shipping-side metric. High Adoption with flat Output is a common pattern in early rollouts. |
How to improve it
- Run scheduled “AI office hours.” Pair a Power User with an Emerging developer for an hour. Watch the Emerging developer’s Adoption climb in the next two-week window.
- Set provider defaults. Make sure new developers have Claude Code installed and configured on day one. Emerging numbers among recent hires often trace to “no one told me to install it.”
- Audit the Emerging cohort. Open /developers, sort by Adoption ascending. Walk the list. Many “Emerging” devs are actually working on infrastructure or platform work where AI isn’t helpful — those are not a problem. Some are stuck on tooling friction. Those are the wins.
- Track adoption trajectory, not snapshot. A developer who moved from Emerging → Explorer in 6 weeks is a win even if they’re still below 50.
- Lower the Maturity Factor while rolling out. At 0.6, more developers feel like they’re making progress as Explorer / Regular. Once you’re 6+ months in, raise it back to 0.75 or higher.
Limitations and gotchas
- The score lags reality by hours, not days. Events sync every few minutes but with a 12-hour safety lag to absorb late-arriving OTEL backfill.
- Pre-2026-03-05 Claude Code data doesn’t exist. Effective Weekdays adjusts for this automatically.
- Cursor data depends on the Cursor API being reachable. If your Cursor sync is broken, devs who only use Cursor will show as Emerging.
- The org P90 ceiling moves with the cohort. Hire a wave of Power Users and the bar rises for everyone. This is intentional but counter-intuitive.
- Direct provider events only. We don’t infer AI usage from PR co-author tags or other heuristics for the Adoption Score (that’s AI-Assisted Percentage).
FAQ
Q: Why don’t Claude and Codex scores get averaged together?
A: Because averaging penalizes developers who use multiple tools. A dev who uses Claude in the morning and Codex in the afternoon should get full daily-use credit. Unioning the events at the factor level achieves that cleanly.
Q: A developer shows score 0 but I know they’re using Claude. What happened?
A: Check (1) the developer’s is_active flag, (2) whether their email aliases are mapped if they have multiple work emails, and (3) whether the date range pre-dates the provider’s data start (March 5, 2026 for Claude). One of those almost always explains it.
Q: Why does Cursor count for less than Claude Code or Codex?
A: Cursor’s event stream is more sparse and less structured than the OTEL exports from Claude / Codex. We use it as confirmatory signal rather than primary evidence — hence the 25% boost rate. Adjustable via env var.
Q: Can I see the four-factor breakdown for a single developer?
A: Yes. Click any developer on /developers to expand them. The agentic panel shows DailyUse, HourlySpread, Prompts, and Output as bars with the developer’s value and the org P90 cap.
Agent Autonomy Score
A 0–100 measure of how often a developer runs AI through multi-step, tool-using sessions — sessions with 10+ tool calls.
Family: Adoption & Agentic · Cadence: Window-based · Where it appears: /ai-adoption/developers, /ai-adoption/ai-impact, /ai-adoption/executive
At a glance
Where the Agent Adoption Score measures how consistently a developer uses AI, the Autonomy Score measures how autonomously. High autonomy means the developer is running AI in agentic mode — multi-step sessions where AI is calling tools, reading files, editing code, running commands. Low autonomy means AI is being used as a Q&A interface (“how do I X?”). Both are valid uses; tracking them separately surfaces a different kind of adoption depth.
Formula
Agentic Score = min(intensity / OrgP90Intensity, 1.0) × 100 × Maturity FactorWhere intensity is a developer-level aggregate of tool_result events from Claude Code and Codex sessions with at least 10 tools used. Returns 0 when the org has no P90 intensity (no data).
How GitKraken Insights calculates it
What counts as an “agentic session.” We define an agentic session as one where the developer used at least 10 distinct tools (e.g. file_read, file_edit, bash_run, web_search, etc.) within a single session. The 10-tool threshold is the heuristic that separates “I asked Claude a question and it called a tool to answer” from “Claude is doing real multi-step work.”
Providers included. Only Claude Code and Codex sessions contribute to Agentic intensity (the backend filters on provider IN ('claude_code', 'codex')). Cursor activity is excluded because Cursor’s event stream doesn’t expose per-session tool calls in a way we can score; Cursor still contributes to the Agent Adoption Score via the Cursor Boost.
Intensity. For each developer, we aggregate tool_result events from their agentic sessions over the window. The result is a single intensity number — higher means more agentic activity.
Normalization. We compute the org-wide P90 intensity across all active developers in the window. The developer’s intensity is divided by the org P90 and capped at 1.0. This is the same normalization pattern as Adoption — the bar is your team, not an industry average.
Critical: the org P90 is always org-wide, never team-filtered. A developer’s Autonomy Score does not change when an admin toggles team filters.
Maturity scaling. The capped ratio × 100 × Maturity Factor produces the final 0–100 score. At the default 0.75 Maturity Factor, a developer at the org’s P90 on agentic intensity scores 75.
Why it matters
Agentic adoption is the deeper rollout signal. A team can have high Adoption (everyone using Claude as a Q&A interface) but low Autonomy (no one letting it run multi-step). Or the reverse — a small group running highly agentic sessions while the broader team hasn’t started.
The most valuable AI productivity gains come from autonomous sessions. A developer asking Claude one question saves 5 minutes; a developer running Claude through a 30-minute agentic refactor saves 2 hours. Tracking autonomy separately lets you see whether your team is moving from the first pattern to the second — which is usually where ROI inflects.
How to read it
| Range | Read it as |
|---|---|
| 60–100 | Strong — developer regularly runs AI through multi-step autonomous work |
| 25–59 | Fair — occasional agentic use; AI is partly an autonomous collaborator |
| 0–24 | Low — AI is being used mostly for Q&A, not autonomous tasks |
A team average above 40 is a strong signal that agentic workflows have taken root. Below 20 is “your team is using AI mostly to ask questions” — which is still useful but a leading indicator that you can extract more value.
Where it appears
- /ai-adoption/developers — separate column or panel next to Adoption. The expanded developer detail breaks down agentic activity by session count and tool diversity.
- /ai-adoption/ai-impact — deep-dive autonomy analysis: tools-per-session distribution, top tools by usage, ranking of high-autonomy developers.
- /ai-adoption/executive — trend line showing org agentic adoption over time.
Settings that affect it
- Maturity Factor — multiplies the final score (default 0.75).
- The agentic threshold (10 tools per session) is not currently configurable. Ask your account manager if you need it tunable.
Related metrics
| Metric | Relationship |
|---|---|
| Agent Adoption Score | Parallel adoption measure. Adoption = consistency. Agentic = depth of autonomous use. |
| AI Tier | Agentic is one of three inputs into the composite Tier (default weight 0.2). See How the metrics fit together for the canonical composite formula and per-org configuration story. |
| Productivity Uplift | Most productivity gains correlate with rising Autonomy, not Adoption. |
How to improve it
- Train the team on agentic prompts. A 30-minute internal session on “give Claude a goal, let it run” can lift Autonomy faster than any other intervention.
- Establish patterns for safe autonomous work. “When can I let Claude refactor unattended?” If your team doesn’t have an answer, Autonomy will stay low. Publishing a one-page playbook usually unblocks it.
- Audit the Emerging Autonomy cohort. Some developers are happy using AI as a search engine forever. That’s fine — but flag the gap. If 70% of your team has Autonomy < 20, you’re not extracting deep value from the tooling spend.
- Pair an Autonomy Power User with a low-Autonomy developer. Same intervention as for Adoption, but specifically targeting agentic workflows.
Limitations and gotchas
- The 10-tool threshold is heuristic. A developer running 9-tool sessions all day will score lower than one running occasional 10-tool sessions.
- Tool count ≠ value. A 50-tool session that achieved nothing scores higher than a 10-tool session that shipped a feature. Use Autonomy alongside Output Score for the full picture.
- Cursor does not contribute to Autonomy. Cursor’s API doesn’t expose per-session tool-call events in a way we can score, so the agentic intensity sum filters to
provider = 'claude_code'andprovider = 'codex'only. Cursor still feeds Agent Adoption via the Cursor Boost. - Org P90 moves with the cohort. As your team matures, the bar rises.
FAQ
Q: Why 10 tools as the agentic threshold? Why not 5 or 20?
A: 10 is the empirical knee in the distribution — at 10+ tools, sessions are reliably “AI doing real multi-step work” rather than “AI calling one tool to answer a question.”
Q: A developer has high Adoption but low Autonomy. Is that a problem?
A: Not necessarily. They’re using AI consistently but mostly as a Q&A tool. Whether that’s a problem depends on the work.
Q: Why isn’t this counted toward Adoption?
A: We want to separate “is the developer using AI?” (Adoption) from “is the developer using AI as an autonomous collaborator?” (Agentic). Conflating them loses information.
AI Tier
The composite category — Power User, Regular, Explorer, Emerging, or On PTO — that every developer is sorted into. Blends adoption consistency, autonomous use, and effort-weighted shipping into a single tier.
Family: Adoption & Agentic · Cadence: Window-based · Where it appears: /ai-adoption/developers, /ai-adoption/teams, /ai-adoption/executive, /ai-adoption/ai-impact, /ai-adoption/ai-tools-comparison
At a glance
The AI Tier is the dashboard’s headline classification — every active developer lands in one of five tiers each window. It’s a deliberate composite of three signals: how consistently the developer is using AI (Adoption), how autonomously (Agentic), and how productively (Output Norm). The weights are configurable per-org in Settings → General (defaults 0.5 / 0.2 / 0.3) — see “The weighted blend” below.
The tier is what drives the Top 10 widget, the executive ranking, the breakdown charts that bucket by AI Tier, and the team-level tier mix bars on /ai-adoption/teams. If you only learn one composite metric in the dashboard, learn this one.
Formula
composite = wAdoption × Adoption + wAgentic × Agentic + wOutput × OutputNorm

where weights are renormalized to sum to 1.0
defaults: 0.5 / 0.2 / 0.3

Tier:
  ≥ 80     →  Power User
  55 – 79  →  Regular
  25 – 54  →  Explorer
  < 25     →  Emerging
  PTO      →  On PTO (override)
How GitKraken Insights calculates it
The three inputs.
- Adoption — the developer’s Agent Adoption Score, 0–100.
- Agentic — the developer’s Agent Autonomy Score, 0–100 (Claude Code + Codex sessions only; Cursor excluded).
- Output Norm — a normalized version of the developer’s Output Score. Computed as
min(devRate / OrgP90Rate, 1.0) × 100 × MaturityFactor, wheredevRate = OutputScore / weeks. Capped at 1.0 before scaling so outlier shippers don’t blow past 100.
All three are already on the same 0–100 scale, and all three are already scaled by the Maturity Factor. They’re directly comparable.
The weighted blend. The three weights — Adoption / Agentic / Output — are stored per-organization in analytics.app_settings under the keys tier_weight_adoption, tier_weight_agentic, and tier_weight_output. Defaults are 0.5 / 0.2 / 0.3. They’re stored raw, then renormalized to sum to 1.0 on every read. So 0.5 / 0.2 / 0.3 renormalizes to 0.5 / 0.2 / 0.3 (already sums to 1); 1.0 / 0.5 / 0.5 renormalizes to 0.5 / 0.25 / 0.25.
Where to change them. The Settings → General form exposes tier weights alongside maturity_factor, developer_hourly_rate, baseline_period_start, and default_department. Edit the tier_weight_* values there and the change takes effect on the next read.
If you set all three weights to zero (or negative), we fall back to defaults rather than producing a NaN. There’s never a “100% output, 0% everything else” boost run.
Classification. Once the composite score is computed, it’s mapped to a tier: 80+ = Power User, 55–79 = Regular, 25–54 = Explorer, <25 = Emerging. The Emerging label is used consistently across the backend enum, the UI badge, the onboarding tour, and the Top-10 widget.
The PTO override. If a developer was on PTO for every weekday in the selected window, they’re forced to the On PTO tier regardless of underlying scores. PTO override is checked first — if ptoFlag is true, we return (0, OnPTO) immediately and skip the composite math.
Window length matters. If the selected window is less than 7 days, the Output Norm is forced to zero (rates can’t be computed over sub-week windows). Tier still works in that case, but it’s effectively a 2-input composite for short windows.
Org P90 is always org-wide. Just like Adoption and Agentic, the Output Norm benchmark is computed across the whole active org, not the team you’re filtering to. A developer’s tier doesn’t change when an admin toggles team filters.
Why it matters
The Tier is the dashboard’s most-used metric for cohort comparison and trend reading. It’s the answer to questions like:
- “What percent of our org is at Regular or above?” — your AI rollout maturity score
- “How does our backend team’s tier mix compare to the mobile team?” — find adoption gaps
- “How many developers crossed from Explorer → Regular last quarter?” — measure rollout velocity
A single developer’s tier is not a performance evaluation. The cohort is the unit of analysis.
How to read it
The tier mix — what percent of your population is in each tier — is more informative than any single tier label. A healthy org in the middle of an active rollout looks like:
| Tier | Healthy range |
|---|---|
| Power User | 10–25% |
| Regular | 30–50% |
| Explorer | 20–35% |
| Emerging | 10–20% |
| On PTO | <5% typical, up to 15% in heavy-vacation months |
If your Power User % is below 5%, your rollout has stalled or your org is genuinely early — check whether Maturity Factor is appropriate.
If your Emerging % is above 25%, you have an onboarding or tooling-friction problem.
If On PTO % is unusually high (>15%), check whether your PTO sync is working.
Where it appears
- /ai-adoption/developers — primary surface. Tier badge on every row, sortable column.
- /ai-adoption/teams — tier mix bars on every team row.
- /ai-adoption/executive — adoption tier bar (clickable tier labels deep-link into /ai-adoption/developers filtered to that tier).
- /ai-adoption/ai-tools-comparison — cohort comparisons use tier as a key segmentation.
- /ai-adoption/ai-impact — productivity analysis uses tier as the primary cohort dimension.
Settings that affect it
- Maturity Factor — scales all three inputs, so it shifts the entire population up or down the tier ladder. Configurable in Settings → General.
- Tier Weights — controls how much Adoption / Agentic / Output each contribute. Defaults 0.5 / 0.2 / 0.3. Per-org in
app_settings; editable in Settings → General. - Direct Commit Weight — affects Output Score, which feeds into Output Norm. Per-org in
app_settings; editable in Settings → General. - Exclude Chore from Output Score — same path through Output. Per-org in
app_settings; editable in Settings → General.
Related metrics
| Metric | Relationship |
|---|---|
| Agent Adoption Score | Input #1. Default weight 0.5. |
| Agent Autonomy Score | Input #2. Default weight 0.2. |
| Output Score | Input #3 (via Output Norm). Default weight 0.3. |
| Maturity Factor | Scales all three inputs uniformly. |
How to improve it
- To move developers from Emerging → Explorer, focus on Adoption. See Playbook — Roll out AI tooling with the Adoption Score.
- To move developers from Regular → Power User, focus on Agentic and Output together. The top tier requires both depth of AI use and shipping at the org’s top rate.
- To shift the org-level tier mix without retraining anyone, tune the Tier Weights. Moving the weights toward Output emphasizes shippers; moving them toward Adoption emphasizes consistent users. (Editable in Settings → General.)
- To grade fairly across teams of different sizes, look at tier mix percentage rather than absolute counts.
Limitations and gotchas
- Org P90 moves. A developer with steady absolute numbers can drop a tier when the rest of the org catches up.
- Sub-7-day windows. Output Norm forces to zero, so Tier in a 5-day window is effectively Adoption + Agentic only.
- Composite hides imbalance. A developer at Adoption=90 / Agentic=30 / OutputNorm=30 has the same composite (~60, Regular) as one at 50/50/50. Always look at the expanded breakdown.
- PTO override is binary. Partial-PTO developers (e.g. 2 weeks of a 4-week window) get no override.
- Tier thresholds are fixed. The 25/55/80 cutoffs don’t move when you change Maturity Factor — only the inputs do.
FAQ
Q: Why a weighted composite instead of just averaging Adoption + Agentic + Output?
A: Different orgs value different signals. An early-stage rollout cares mostly about Adoption. A mature org cares mostly about Output. The weighted composite lets you tune which signal drives the Tier.
Q: What does “On PTO” do to team averages?
A: On-PTO developers are excluded from average score, Power User %, active-adoption %, and the Top 10. They’re still in the roster, just not in those aggregates.
Q: Can a single developer’s tier change just because the org changed?
A: Yes. Tier is normalized to the org P90 for Output, and the P90 caps for Adoption / Agentic are also org-wide.
Q: I set Tier Weights to 0.7 / 0.0 / 0.3 — what happens to Agentic?
A: Agentic is silently weighted at 0 in the composite. Renormalization still works. Agentic Score still displays separately on the developer detail panel.
Maturity Factor
An org-wide scaling knob (default 0.75) that adjusts the ceiling on every P90-based score so the tier distribution fits your organization’s actual AI maturity.
Family: Adoption & Agentic (org-level setting) · Where it appears: Settings → General; affects every score on /ai-adoption/developers, /ai-adoption/teams, /ai-adoption/executive
At a glance
The Maturity Factor is a single number from 0.01 to 1.00 that scales every P90-normalized score in the dashboard. At its default of 0.75, a developer at the org’s 90th percentile scores 75 — leaving headroom to grow into the Power User band (≥80). At 1.00, the same developer would score 100, and a much larger chunk of your team would land in Power User. The setting exists so you can match the tier ceiling to where your org actually is in its AI rollout.
It is the single most consequential admin setting in the product. Changing it shifts the entire tier distribution for everyone in your org overnight, so it should be discussed before you change it.
Formula
ScoreAfterMaturity = ScoreBeforeMaturity × MaturityFactor

Applied to:
  Adoption    = min(Primary + 0.25 × Cursor, 100) × MaturityFactor
  Agentic     = min(intensity / OrgP90, 1.0) × 100 × MaturityFactor
  OutputNorm  = min(devRate / OrgP90Rate, 1.0) × 100 × MaturityFactor
How GitKraken Insights applies it
It is not calculated — it is set. Admins choose a value in Settings → General under the label “Company AI Readiness %”.
The setting is stored in the app_settings table as maturity_factor. The backend reads it dynamically and threads it through every score computation. If the setting is absent or invalid (outside [0.01, 1.0]), the default 0.75 is used.
There is no per-team, per-developer, or per-page override. It is one value, applied uniformly.
Why it matters
P90-based scoring has a built-in problem: if you anchor the top of the scale to the org’s 90th percentile, then the top 10% of developers always score 100, regardless of actual maturity. That is fine if your org is mature and your top 10% genuinely are world-class AI users. It is misleading if you are 6 months into a rollout and your top 10% are just slightly less Emerging than everyone else.
The Maturity Factor solves this by saying: “at our current org maturity, even a P90 developer only deserves a 75 — we are not at the ceiling yet.” As the org matures, raise the factor toward 1.0 to reflect that the bar has genuinely been reached.
It is the dial that prevents premature “everyone is a Power User!” inflation in early rollouts, and the dial that lets you eventually retire the artificial ceiling once your org has earned the top tier.
How to read it
| Value | What you are saying about your org |
|---|---|
| 0.50 – 0.65 | “We are early. Most of our team is still adopting. The Power User band should be hard to reach.” |
| 0.70 – 0.80 | “We are in active rollout. The top tier is achievable but should require real effort.” |
| 0.80 – 0.90 | “We are mature. Our top 10% genuinely are world-class AI users.” |
| 0.95 – 1.00 | “We have fully internalized AI. The Power User band is the working baseline.” |
The default (0.75) is calibrated for “active rollout” — the most common state we see.
Where it appears
- Settings → General → “Company AI Readiness (%)” — the input that controls it. Shows a live preview (“At this maturity, a perfect score is X points”).
- Affects every page that displays Adoption, Agentic, or Output Norm scores. Including /ai-adoption/developers, /ai-adoption/teams, /ai-adoption/executive, /ai-adoption/ai-tools-comparison, /ai-adoption/ai-impact.
Related metrics
| Metric | Relationship |
|---|---|
| Agent Adoption Score | Multiplied by Maturity Factor as the final step. |
| Agent Autonomy Score | Multiplied by Maturity Factor as the final step. |
| Output Score → Output Norm | Output Norm is multiplied by Maturity Factor. Raw Output Score itself is not. |
| AI Tier | Indirectly — the tier thresholds (25 / 55 / 80) stay fixed, but the inputs scale. |
How to use it
- Announce before you change. Lowering Maturity Factor from 0.85 → 0.75 will move a chunk of Regulars down to Explorer overnight. Tell people before the next /ai-adoption/teams snapshot is taken.
- Pair changes with milestones. “We have hit 70% Regular+. We are raising the Maturity Factor to 0.85 to reflect that the bar has been reached. Some of you will drop a tier; that is by design — we are raising the ceiling because you have earned it.”
- Don’t change it more than twice a year. It is a strategic setting, not a tactical knob.
- Use it intentionally during demos. Demo profiles ship with Maturity Factor 0.75 so the headline tier distribution looks like a real org. Don’t reset it for show-and-tell.
Limitations and gotchas
- It scales scores, not tier thresholds. Lowering Maturity Factor lowers everyone’s scores; it does not shift the tier cutoffs (25 / 55 / 80). So a 10-point Maturity Factor change will move some developers between tiers.
- Power User % drops linearly with Maturity Factor changes. Roughly, lowering from 1.0 → 0.75 cuts your Power User % by ~25–35% as developers near the 80 threshold drop below it.
- The setting is org-wide. You can’t have one Maturity Factor for the Backend team and a different one for Mobile.
- No retroactive recalculation. Changing Maturity Factor immediately affects current-window scores, but does not rewrite historical snapshots. Trend lines will show the discontinuity.
- Cohort comparisons stay valid across changes. Tier mix ratios within a single window are unaffected by Maturity Factor changes — the gap between teams is what matters; the absolute number shifts.
FAQ
Q: Why default to 0.75 instead of 1.00?
A: Most orgs running Insights are in active rollout, not at full maturity. 0.75 is calibrated for that state. If we defaulted to 1.0, every early-stage customer would see “100% Power User” within weeks and the tier signal would become useless.
Q: When should I raise it to 1.0?
A: When your team’s working baseline genuinely is high-autonomy, daily-use AI integration. A useful threshold: if you can credibly tell your CTO “we have reached the point where AI is the default mode of working, not the exception,” it is time to raise Maturity Factor.
Q: Will lowering it make my team feel demoralized?
A: Possibly, if you don’t announce it. Always frame the change as “we are raising the bar because you have earned it” rather than “you have all dropped a tier.”
Q: Is there a per-team Maturity Factor?
A: No. It is intentionally one global value. Per-team Maturity Factor would defeat the point of comparing teams against a common bar.
Cursor Boost
The 25% (default) multiplier applied to a developer’s Cursor adoption score before it layers into the headline Agent Adoption Score.
Family: Adoption & Agentic · Where it appears: Behind the scenes in the Adoption Score on /developers, /teams, /executive
At a glance
GitKraken Insights treats Claude Code and Codex as “primary” AI tools and Cursor as a “secondary” one. Primary tools have their events unioned at the factor level into one combined score. Cursor is scored independently and added to that primary score at a discount — the Cursor Boost rate — before the final score is capped at 100. The default discount is 25%, configurable via an environment variable.
This page exists so admins understand why a developer’s Cursor activity contributes meaningfully to their Adoption Score but doesn’t dominate it.
Formula
Final Adoption (pre-maturity) = min(Primary + secondaryBoost × Cursor, 100)
  Primary = blend(Claude ∪ Codex)
  Cursor  = blend(Cursor events alone)
  secondaryBoost = 0.25 (default)
If Cursor data is absent (nil), the boost term is dropped entirely — no Cursor activity, no boost.
How GitKraken Insights calculates it
Step 1. Per-provider scoring for Cursor runs the same four-factor blend (Daily Use, Hourly Spread, Prompts, Output) used for Claude and Codex — see Agent Adoption Score for the mechanics.
Step 2. The resulting Cursor score (0–100) is multiplied by the secondaryBoost rate (default 0.25 = 25%). So a developer at Cursor=80 contributes 80 × 0.25 = 20 points of additional adoption.
Step 3. The boosted value is added to the Primary score (Claude ∪ Codex) and the sum is capped at 100 before Maturity Factor scaling.
Edge case: primary is zero. If a developer has no Claude/Codex activity but has Cursor activity, they still get the Cursor boost as their entire pre-maturity score. So a dev with Primary=0, Cursor=80 gets 0 + 20 = 20 pre-maturity, which becomes 15 at the default Maturity Factor of 0.75. They land in Emerging but at the high end — visible as “trying Cursor only.”
Why the asymmetric treatment
Claude Code and Codex export OpenTelemetry traces with detailed prompt/response/token/tool data. Cursor’s API exports a less complete event stream — fewer fields, sparser timing, no token counts in some cases. We use Cursor data as confirmatory signal rather than primary evidence:
- If a developer is using Cursor consistently, we want their Adoption Score to reflect that.
- But we don’t trust Cursor data enough to make it a 1:1 substitute for Claude / Codex.
The 25% boost rate is the empirical middle ground — high enough that Cursor power-users score meaningfully, low enough that incomplete data doesn’t mask gaps in primary-tool adoption.
How to read it
You don’t typically read the Cursor Boost in isolation. What you read is the breakdown on a developer’s expanded detail panel:
- A developer with Claude=70, Cursor=80 has Primary=70 + boost=20 → pre-maturity 90 (capped at 100), final 67.5 at MF=0.75.
- A developer with Claude=70, no Cursor data has Primary=70, no boost → pre-maturity 70, final 52.5.
The difference (15 points) is what Cursor adoption is contributing in that developer’s case.
Where it appears
- /developers — expanded panel breaks down “Claude contribution” / “Codex contribution” / “Cursor contribution” so you can see what each tool is doing for a developer’s score.
- Behind the scenes in every Adoption Score on the dashboard.
Settings that affect it
SCORE_SECONDARY_BOOSTenvironment variable. Default 0.25. Range 0.0 to 1.0+. Changing it requires a backend restart.
The Cursor Boost rate is not currently exposed in the Settings UI. Ask your account manager if you need it tunable.
Related metrics
| Metric | Relationship |
|---|---|
| Agent Adoption Score | Cursor Boost is one of two terms in the Adoption Score formula. |
| AI Tier | Indirectly — Cursor adoption shows up here via Adoption Score. |
How to use it
Cases where you might want to change the boost rate:
- You’ve standardized on Cursor as a primary tool. If your org has gone “Cursor-first” rather than “Claude-first,” consider raising the boost to 0.5 or higher so Cursor adoption contributes proportionally.
- You want Cursor to count equally with Claude / Codex. Set the boost to 1.0. Now a Cursor-only developer can score the same as a Claude-only developer.
- You want to phase Cursor out. Set the boost to 0. Cursor data is ignored in adoption math (it still appears in /data and other detail views).
In most orgs, the default 0.25 is the right answer. Touch it only when your provider mix has genuinely shifted.
Limitations and gotchas
- No agentic score from Cursor. Cursor’s events don’t expose tool-call data in a way we can score for the Agent Autonomy Score. So a developer doing all their autonomous AI work in Cursor will look low-Autonomy in the dashboard regardless of their actual practice.
- Boost is additive, not blended. We don’t union Cursor events with Claude/Codex at the factor level (the way we do for Claude+Codex). Cursor is scored separately and then layered on.
- Pre-cap addition. Because we cap at 100 after the boost is added, a developer at Primary=95 + Cursor=80 caps at 100 — the last 15 points of potential Cursor contribution are wasted.
FAQ
Q: Why isn’t Cursor unioned with Claude / Codex?
A: Their event streams aren’t comparable enough at the field level. We’d need consistent prompt counts, token counts, and tool counts across all three providers to union them; Cursor doesn’t currently export that consistently. As Cursor’s API matures, this could change.
Q: A developer uses Cursor exclusively and shows score 15. Is that right?
A: At default settings, yes. Cursor=80 × 0.25 boost × 0.75 Maturity Factor = 15. If your org is Cursor-first, raise SCORE_SECONDARY_BOOST to 0.75 or 1.0 to give Cursor users a fair share of the score.
Q: Why default 25% and not 50%?
A: Empirically, the data we get from Cursor today is roughly a quarter as rich as what we get from Claude / Codex OTEL traces. 25% reflects “Cursor counts about as much as the data we have on it.” If Cursor’s event coverage improves, we’d raise the default.
