
Last updated: June 2026
This family answers: how fast does work move through your system, and where does it get stuck?
Where the Output family asks “how much shipped?”, Flow asks “how smooth was the journey from idea to merge?” These are the operational metrics — the ones team leads watch weekly and engineering leaders read for systemic patterns.
The metrics
| Metric | What it captures |
|---|---|
| Cycle Time | Total hours from first commit to merge (or deploy). The headline flow metric. Broken into four phases: Coding, Pickup, Review, Deploy. |
| Review Cycles | Average rounds of “changes requested” per PR before merge. A signal of PR size and review fit. |
| First-Pass Rate | Percent of PRs merged with zero “changes requested” reviews. The clean-merge rate. |
| WIP | Number of currently open PRs. The work-in-progress backlog. |
The four cycle phases
When you see Cycle Time broken down, these are the phases:
| Phase | What it measures |
|---|---|
| Coding | First commit to PR open. The “writing the code” time. |
| Pickup | PR open to first review activity. The “PR sitting unattended” time. |
| Review | First review to last review-related event. The “back and forth” time. |
| Deploy | Merge to production deploy (only populated when release detection is configured for the repo). |
Reading Cycle Time by phase is almost always more useful than reading the total. A 5-day Cycle Time that is 80% Pickup tells you something very different than a 5-day Cycle Time that is 80% Coding.
Read this family
Three common patterns:
- Long Pickup phase → review queue is over-committed. Symptoms: WIP rising, fewer reviewers active. Fix: review-clearing ritual, reviewer rotation.
- Long Review phase → PRs too big, or reviewers asking for too many changes. Symptoms: high Review Cycles, low First-Pass Rate. Fix: split PRs, write better PR descriptions.
- Long Coding phase → could be deep work (fine) or stalled work (not fine). Cross-check with WIP and developer-level activity to tell which.
Where this family shows up
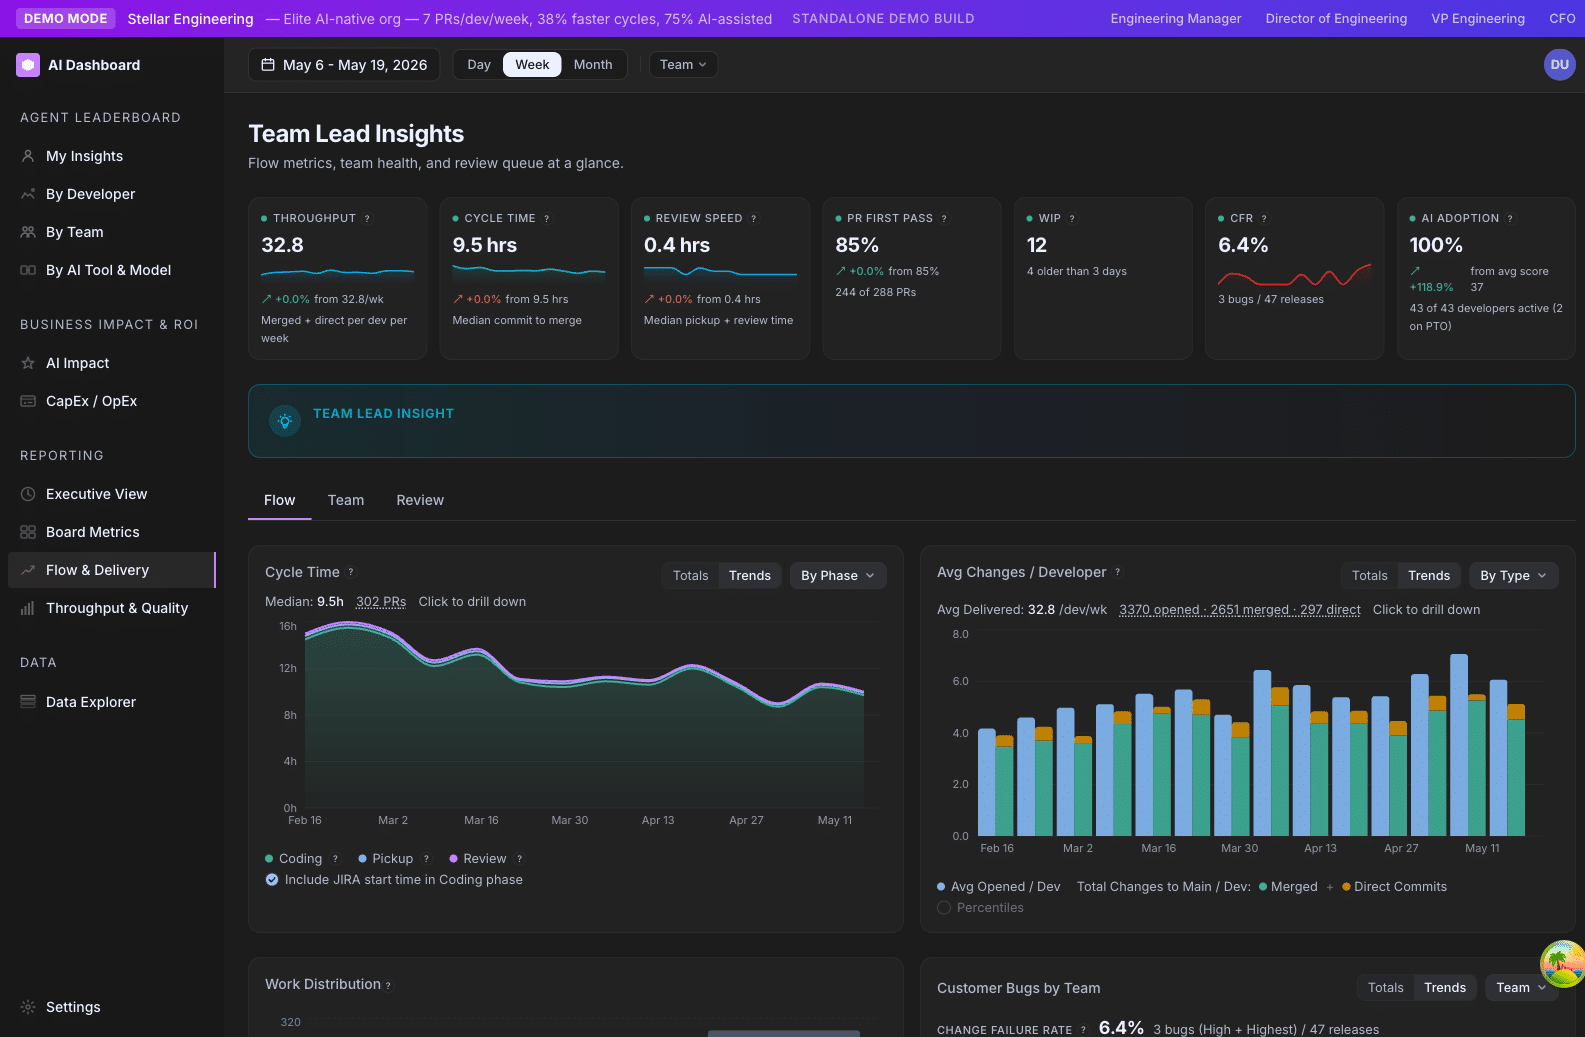
- /ai-adoption/ai-impact — Cycle Time chart with phase breakdown, Totals/Trends toggle, and the Cycle-Time-by-AI-Tier view.
- /ai-adoption/teams — Cycle Time column on the team table; expanded rows show the trend and phase breakdown.
- /ai-adoption/executive — Cycle Time as a hero KPI and trend line.
- /ai-adoption/developers — per-developer cycle time in the expanded developer detail.
- PR drill-down tables — clicking into a Cycle Time or PR Volume chart point opens a table with per-PR Cycle Time, Review Cycles, and Effort columns.
A note on the “Include JIRA start time” toggle
When the “Include JIRA start time in Coding phase” toggle is on, the Coding phase extends backward to include the time between the JIRA issue’s in-progress transition and the first commit. This gives a more complete picture of “time from commitment to ship” — but it requires JIRA integration and a consistent in-progress workflow.
The toggle is on by default in the app. If your team doesn’t use JIRA, or your in-progress workflow is inconsistent, turn it off so Cycle Time starts at first commit instead.
Cycle Time
Total hours from a PR’s first commit to its merge (and optionally to deploy). The headline operational health metric — how fast work flows from idea to shipped.
Family: Flow & Cycle Time · Cadence: Per PR, aggregated for views · Where it appears: /ai-adoption/ai-impact, /ai-adoption/teams, /ai-adoption/executive, /ai-adoption/developers
At a glance
Cycle Time is the single most informative operational metric in the dashboard. It answers “how long does it take a piece of work to go from first keystroke to merged?” Lower is generally better — but the composition of the time (which phase dominates) matters more than the total. A 5-day Cycle Time made of 1 day Coding + 4 days Pickup tells a very different story than one made of 4 days Coding + 1 day Pickup. The phase breakdown is the part to read first.
Formula
Cycle Time = Coding + Pickup + Review + Deploy

  Coding  = first commit → PR open
  Pickup  = PR open → first review activity
  Review  = first review → last review event
  Deploy  = merge → production deploy (if release detection is configured)
For a team or org view, Cycle Time is shown as an average (mean) across PRs in the window, with phase contributions visualized as a stacked bar or area.
How GitKraken Insights calculates it
The four phases. Cycle Time is decomposed into four phases. Each PR’s timestamps are computed and the phase durations are summed:
- Coding — from the PR’s first commit (
first_commit_at) to when the PR was opened (opened_at). Captures “writing the code before showing anyone.” - Pickup — from PR open to the first review-related event (first review comment, first approval, first changes-requested). Captures “PR is waiting for someone to look at it.”
- Review — from the first review event to the last review event. Captures the back-and-forth time.
- Deploy — from
merged_atto the production deploy timestamp. Only populated when release detection is configured for the repo. When release detection is not set up, the Deploy phase is omitted from the total rather than substituted with anything else.
The “Include JIRA start time” toggle. When this toggle is on (the default in the app), the Coding phase extends backward to include the time between when a JIRA issue moved to In Progress and the first commit. This converts Cycle Time into “time from team-committed to shipped,” which is the more meaningful business metric — but it requires consistent JIRA workflow discipline. Turn the toggle off if your team doesn’t use JIRA or your in-progress workflow is inconsistent.
Aggregation. For a team or org row, we average the phase durations across all PRs merged in the window. Drafts are excluded. Bot-authored PRs are excluded.
Outlier handling. The metric does not trim outliers automatically. A PR that sat open for 90 days will heavily skew a 30-day average. The phase-breakdown views visualize the distribution so you can spot the long tail, and the median is shown on hover as a check against outlier-skewed means.
Why it matters
Cycle Time is the dashboard’s most reliable operational health signal because it integrates many smaller signals into one number:
- Slow Cycle Time usually means slow review (Pickup phase) — your highest-leverage fix.
- Sometimes it means PRs are too big (Review phase) — fix with size discipline.
- Occasionally it means stalled work (Coding phase) — fix with WIP discipline.
Cycle Time also correlates strongly with team morale. Developers who watch their PR sit open for three days disengage from the work and from the review process. Tight Cycle Time correlates with higher engagement, less work in flight, and more shipped iterations.
For AI adoption analysis, Cycle Time is the metric most likely to show adoption paying off in delivery. AI tools reduce Coding phase first; they then enable smaller PRs which reduces Review phase. Watching Cycle Time trend down alongside Adoption Score trending up is the canonical “AI is delivering value” story.
How to read it
Median industry numbers for typical web and services engineering teams:
| Total Cycle Time | Read it as |
|---|---|
| < 24 hours | Elite — fast, lean teams with strong review discipline |
| 1 – 2 days | Strong — typical for high-performing engineering orgs |
| 2 – 4 days | Fair — common in larger orgs; usually has Pickup or Review opportunity |
| 4 – 7 days | Needs attention — investigate phase breakdown |
| > 7 days | Stuck — review process broken, or PRs structurally too big |
Always read the phase breakdown before drawing conclusions. The most common pattern in teams over three days is Pickup dominates — PRs sit waiting for review. The fix is almost always tighter review queue discipline, not faster coding.
Where it appears
- /ai-adoption/ai-impact — two side-by-side Cycle Time cards: left = trend only, right = breakdown with dimension dropdown and Totals/Trends toggle. The Cycle-Time-by-AI-Tier view also lives here.
- /ai-adoption/teams — Cycle Time column on the team table; expanded rows show the trend with phase breakdown.
- /ai-adoption/executive — Cycle Time as one of the headline trend lines and a hero KPI.
- /ai-adoption/developers — per-developer cycle time in the expanded developer detail.
Settings that affect it
- “Include JIRA start time” toggle (on Cycle Time charts). Requires JIRA integration. Default: on.
- JIRA integration (instance-level config) — without it, the JIRA-extended Coding phase is unavailable.
- Release detection — without configured releases, the Deploy phase is omitted.
No other admin settings affect Cycle Time. It is a measurement.
Related metrics
| Metric | Relationship |
|---|---|
| Review Cycles | The cause of long Review phase. Read together. |
| First-Pass Rate | Inversely correlated with Review phase length. |
| WIP | High WIP often causes high Pickup (reviewers overloaded). |
| Throughput | Outflow rate vs. how-long-each-takes. |
| Lead Time for Changes | DORA’s first-commit-to-deploy version. Similar but production-scoped. |
How to improve it
Listed by leverage — start at the top:
- Establish a weekly review-clearing ritual. Fifteen minutes per week to walk through the oldest open PRs. Decide: ship, give a deadline, or close. This single habit fixes the Pickup phase on most teams within 2–4 weeks.
- Right-size PRs. Teams with high Cycle Time and high Review Cycles are over-batching. Aim for PRs that can be reviewed in 15 minutes.
- Reduce reviewer load. A team with 6 developers and 25 open PRs has a reviewer problem, not a coder problem.
- Use AI to clean up small PRs. Routine small PRs (formatting fixes, tests, docs) lend themselves to AI-assisted shipping. Moving the long tail of small work to AI-assisted flow can free reviewer time for substantive PRs.
- Set a Cycle Time target as a team. A target like “median Cycle Time under 36 hours” gives the team a shared goal and makes the metric actionable rather than diagnostic.
Limitations and gotchas
- One outlier skews the mean badly. A PR that sat open for 60 days will dominate a monthly Cycle Time average. Always cross-check with the median.
- Cycle Time can’t see commits before the PR is opened that aren’t on a tracked branch. If a developer codes for three days on a local branch with no pushes, their Coding phase reads as ~0.
- JIRA-extended Coding requires discipline. If your team marks issues “In Progress” inconsistently, the JIRA-extended Coding phase becomes noisy.
- Deploy phase is binary — present or absent. Without release detection configured, the Deploy phase is just omitted.
- Bot PRs and drafts are excluded. Dependabot’s auto-merged dependency upgrades aren’t pulling down the average.
FAQ
Q: Should I optimize toward “shortest possible Cycle Time”?
A: No. Push toward “predictable, low-variance Cycle Time.” A team with a tight 36–48 hour distribution is healthier than a team with a wild range from 4 hours to 4 days, even if the second team’s average is lower.
Q: Why does our team’s Cycle Time look terrible the week before a release?
A: Pre-release weeks accumulate PRs that were held back for the release. They merge in a burst, but their Coding and Pickup phases stretched across the embargo. Normal artifact.
Q: My team’s median is 18 hours but the mean is 72 hours. Which should I use?
A: Median tells you “what is typical.” Mean tells you “what is the headline number including outliers.” For leadership reports, lead with median; mention mean as a tail signal.
Q: How is Cycle Time different from Lead Time?
A: Cycle Time is first commit → merge. Lead Time (DORA) is first commit → production deploy.
Review Cycles
The average number of “changes requested” reviews a PR receives before it gets merged. Bucketed as 0 / 1 / 2 / 3+.
Family: Flow & Cycle Time · Cadence: Per PR, aggregated · Where it appears: /ai-adoption/ai-impact, PR drill-down tables
At a glance
Review Cycles counts how many rounds of “changes requested” each PR went through. A PR merged with zero changes-requested reviews has 0 cycles (a clean first-pass). One round of “please fix X” before approval is 1 cycle. Two rounds is 2. Three or more is 3+.
It is one of the dashboard’s better diagnostic metrics — a high cycle count is almost always either too-big PRs, unclear specs, or mismatched author and reviewer expectations. Each of those has a different fix.
Formula
Review Cycles per PR = number of CHANGES_REQUESTED reviews before merge

Bucketed as 0 / 1 / 2 / 3+ for aggregate views
The PR record stores approved_at (the first APPROVED-review timestamp) and review_cycles (the count of CHANGES_REQUESTED reviews).
How GitKraken Insights calculates it
For each merged PR, the backend counts reviews with state CHANGES_REQUESTED that occurred before the PR was merged. That count is stored on the PR record as review_cycles.
For aggregate views (team-level, org-level), the metric is shown either as the mean number of cycles, or as the distribution across the four buckets (0 / 1 / 2 / 3+) as stacked bars or breakdown lines.
The buckets are the more useful presentation — they show the shape of the problem rather than just the average. A team averaging 1.0 cycles could be evenly distributed across the buckets or could be “everyone gets exactly 1 cycle.” Those need different fixes.
Why it matters
Review Cycles tells you about a few different problems at once:
- PR size. Big PRs accumulate more reviewable surface area, more review feedback, more cycles. High cycles usually correlate with high effort scores.
- Spec clarity. When developers don’t have a clear spec, the review becomes the spec. Cycles spike.
- Reviewer-author calibration. A reviewer who reflexively requests changes on every PR will inflate cycles regardless of PR quality.
- Style guide drift. PRs failing for inconsistent style or lint should not show up here — but if your team’s automation isn’t catching those, they will.
Compared to Cycle Time, Review Cycles is more causal. Cycle Time tells you it took 5 days; Review Cycles tells you it took 5 days because of three rounds of back-and-forth.
How to read it
| Team average | Read it as |
|---|---|
| < 0.5 | Strong — most PRs go through clean. Code quality at submission is high. |
| 0.5 – 1.0 | Healthy — typical for orgs with good but not great PR discipline. |
| 1.0 – 2.0 | Fair — every PR averages a round of revisions. Look at PR size and spec clarity. |
| > 2.0 | Needs attention — chronic back-and-forth. PRs are likely too big, or specs are too thin. |
The distribution matters as much as the mean. A team with 60% at 0 cycles, 30% at 1, and 10% at 3+ has a small problem cohort. A team with 50% at 0, 30% at 1, 15% at 2, 5% at 3+ has the same mean but a worse tail.
Where it appears
- /ai-adoption/ai-impact — Review Cycles bucketed breakdown is available as a dimension on Cycle Time and PR Volume charts.
- PR drill-down tables — every PR drill-down has a Cycles column.
Settings that affect it
None. Review Cycles is a measurement.
Related metrics
| Metric | Relationship |
|---|---|
| First-Pass Rate | The “0 cycles” percentage, expressed as a positive metric. |
| Cycle Time | Long Review phase is usually high Review Cycles. |
| Effort Score | High-effort PRs tend to have more review cycles. Track together. |
How to improve it
- Split big PRs. The single most effective intervention. PRs that take 15 minutes to review get 0 cycles. PRs that take 90 minutes to review get 3.
- Write better PR descriptions. A PR with a clear “what / why / how to test” description gets approved faster than one with title only. AI-assisted PR descriptions are a low-effort win here.
- Tighten the spec before coding. PRs that change scope during review are PRs that get cycles. Get spec alignment in the design stage, not the review stage.
- Calibrate reviewers. If one reviewer’s PRs always get more cycles than peers, have a quick conversation. Reviewer perfectionism is a fixable habit.
- Automate style enforcement. Lint failures, formatting nits, and type errors should never be in a human review. If they are, your CI isn’t catching them.
Limitations and gotchas
- Doesn’t measure the quality of feedback. A PR with three cycles that resulted in genuinely better code is a healthy outcome; a PR with 0 cycles that shipped a bug is not. Use Review Cycles alongside CFR.
- Doesn’t count dismissed reviews. A “changes requested” that gets dismissed without action still counts as a cycle.
- A PR that bypasses formal review (e.g. small fix from a senior IC, merged after a comment) shows as 0 cycles.
FAQ
Q: A team has high Review Cycles but low CFR. Are we just being too picky?
A: Possibly, but probably not. Thorough review catches real problems before they ship — high cycles + low CFR is the trade. The interesting question is whether the time cost of those cycles outweighs the bug-prevention value.
Q: One developer’s PRs have 4× the cycles of the team average. Is that a performance issue?
A: Maybe, but check the work first. PRs in unfamiliar domains, big refactors, or risky changes naturally accumulate review feedback.
Q: Does this count “approving but with suggestions” reviews?
A: No. Only formal CHANGES_REQUESTED reviews count.
First-Pass Rate
Percent of PRs merged with zero “changes requested” reviews. The clean-merge rate.
Family: Flow & Cycle Time · Cadence: Per window, percent across all merged PRs · Where it appears: /ai-adoption/ai-impact
At a glance
First-Pass Rate is the inverse of Review Cycles, expressed as the percentage of PRs that get merged without a single round of “please fix X.” It is the cleanest signal in the dashboard for “is our code quality at submission high?” A high rate means developers are submitting work that is ready to ship. A low rate means either submissions are sloppy or reviews are nitpicky — the next step is to drill into Review Cycles to find out which.
Formula
First-Pass Rate = count(merged PRs with 0 review cycles) / count(merged PRs in window) × 100%How GitKraken Insights calculates it
The backend counts merged PRs in the window. For each, it checks whether review_cycles = 0 (no CHANGES_REQUESTED reviews before merge). The count of zero-cycle PRs is divided by the total and expressed as a percentage.
Drafts and bot-authored PRs are excluded. Direct commits are excluded because they don’t go through formal review.
Why it matters
First-Pass Rate is one of the few metrics where the direction is interpretable on its own without context. A higher rate is almost always better, with one exception (see “Limitations” below).
It is especially valuable as a leading indicator for AI adoption ROI. When teams successfully integrate AI into their workflow, First-Pass Rate climbs — AI helps catch the small issues that would have triggered a review cycle (missing tests, naming inconsistencies, edge cases). Watching First-Pass Rate trend up alongside Adoption Score is one of the cleanest “AI is paying off” stories you can tell.
How to read it
| Rate | Read it as |
|---|---|
| 75 – 100% | Strong — most PRs ship clean. Code quality and review fit are aligned. |
| 55 – 74% | Healthy — typical for high-functioning engineering teams. |
| 35 – 54% | Fair — every other PR needs a revision round. Investigate PR size and spec clarity. |
| < 35% | Needs attention — review is doing the heavy lifting of design or spec work. |
One nuance: rates above ~85% can also signal rubber-stamping. If a team’s First-Pass Rate is 95% and CFR is rising, your reviewers may not be looking hard enough. Read First-Pass Rate alongside CFR.
Where it appears
- /ai-adoption/ai-impact — available as a breakdown dimension on PR Volume charts.
Settings that affect it
None. First-Pass Rate is a measurement.
Related metrics
| Metric | Relationship |
|---|---|
| Review Cycles | First-Pass Rate is “the % at 0 cycles” — same data, different framing. |
| Cycle Time | High First-Pass Rate tightens the Review phase. |
| CFR | Always read together. High First-Pass + high CFR = rubber-stamping. |
How to improve it
- Shrink PR scope. Smaller PRs ship clean more often. This is the same root-cause fix as for Review Cycles.
- Strengthen the pre-review checklist. A simple PR template with “tests added? docs updated? changelog?” catches the trivial revisions before they reach a reviewer.
- Adopt AI-assisted self-review. Have AI review your own PR before requesting human review. It catches the small stuff (typos, naming, missing tests) reliably.
- Calibrate reviewers as a team. If half your team has 80% First-Pass Rate and half has 40%, the variance is the reviewer, not the code.
Limitations and gotchas
- High rates can mean rubber-stamping. Always cross-check with CFR. If both are healthy, you have a great team. If First-Pass is high but CFR is rising, your reviewers are letting things through.
- Single-reviewer dynamics. Teams where one or two developers do all the reviewing will have rates dominated by those reviewers’ personalities, not by the broader team’s quality.
- Trivial PRs inflate the rate. A team that ships lots of formatting or dep-bump PRs will have high First-Pass Rate that doesn’t reflect substantive work. Filter to Effort Score 0.3+ for a more meaningful read.
FAQ
Q: Is 100% First-Pass Rate a good thing?
A: Only if your CFR is also low. A team that never requests changes is a team that is either preternaturally good or not reviewing. Probably the latter, statistically.
Q: A developer has 30% First-Pass Rate. Is that a performance issue?
A: Not on its own. They may be working on harder problems, more contested code areas, or under tighter spec ambiguity. Use it as a conversation starter, not a verdict.
Q: Does this include PRs where someone leaves a comment but doesn’t formally request changes?
A: No. Comments without a CHANGES_REQUESTED state don’t reduce First-Pass Rate. Only formal change requests count.
Work In Progress (WIP)
Number of pull requests currently open. The backlog of unmerged work.
Family: Flow & Cycle Time · Cadence: Point-in-time snapshot, trended over the window · Where it appears: /ai-adoption/ai-impact
At a glance
WIP is the simplest metric in the dashboard. It is the count of open PRs — a snapshot of how much work is in flight at any moment. Despite being simple, it is one of the most operationally useful: a rising WIP almost always means a problem (reviewers overloaded, PRs stalled, big-bang releases incoming), and a flat low WIP almost always means a healthy flow.
It is the metric every team lead should glance at every Monday morning.
Formula
WIP = count(open PRs at snapshot time)For trend lines, the count is sampled at fixed intervals across the window and plotted.
How GitKraken Insights calculates it
A PR is in WIP if its state = 'open' and it is not a draft. Bot-authored PRs are excluded.
For the trend view, the backend samples the count at a daily cadence (or whatever the chart granularity is set to) and plots it.
Why it matters
WIP is the metric that links your team’s review process to your team’s flow:
- High WIP relative to team size = review bottleneck. Rule of thumb: WIP should be 1.5–2× the number of active developers. A team of six with 25 open PRs has too much in flight.
- Rising WIP over time = problem brewing. Even if absolute WIP is moderate, a trend up is a leading indicator that something is broken.
- WIP suddenly dropping is suspicious. Usually it is a release week clearing the queue, but occasionally it is “we gave up on a chunk of work” — worth investigating either way.
How to read it
For per-team WIP, rule-of-thumb thresholds:
| WIP per active developer | Read it as |
|---|---|
| < 1.5× | Lean — likely shipping fast |
| 1.5× – 2.5× | Healthy — typical for engaged teams |
| 2.5× – 4× | High — review queue likely backed up |
| > 4× | Stuck — major flow problem, action needed |
For org-level WIP, watch the trend. Sudden spikes always tell a story. Slow drifts upward over weeks usually indicate review process drift.
Where it appears
- /ai-adoption/ai-impact — WIP trend chart available as a breakdown view.
Settings that affect it
None. WIP is a raw count.
Related metrics
| Metric | Relationship |
|---|---|
| Cycle Time | High WIP often causes a long Pickup phase (reviewers overloaded). |
| Throughput | Outflow rate. WIP / Throughput ≈ average days a PR sits open. |
| Review Cycles | Indirectly — PRs with many cycles contribute to higher WIP. |
How to improve it
- Run a weekly review-clearing ritual. 15 minutes on Monday. Walk through the oldest open PRs in your repo. Ship, deadline, or close each one.
- Set a team WIP limit. “No more than 12 open PRs at once.” When you hit the limit, no one opens a new PR until one merges. Forces the team to clear the queue.
- Reviewer rotation. A team with one designated reviewer accumulates WIP fast. Rotate or spread the review load.
- Close abandoned PRs. Some PRs in WIP are dead — the author moved on, the work was descoped, the approach changed. Closing them clarifies the actual backlog.
Limitations and gotchas
- A snapshot, not an average. WIP varies through the week (highest Thursday afternoon, lowest after weekend merges). One snapshot can mislead; trend tells the story.
- Drafts are excluded. A team that uses drafts heavily has WIP that under-counts the actual work in flight.
- Bots are excluded.
- No size weighting. WIP doesn’t care if those 25 open PRs are all 0.1-effort dep bumps or all 0.9-effort migrations.
FAQ
Q: We use stacked PRs (PR2 depends on PR1). Does that inflate WIP?
A: Yes — every open PR counts. If your team uses stacking heavily, your WIP rule-of-thumb threshold should be higher (closer to 3× active devs).
Q: A specific old PR has been open for six months. Should I close it?
A: Almost certainly yes. PRs older than ~30 days are vanishingly likely to merge. They distort WIP and waste reviewer mental bandwidth.
Q: How do I see which PRs are in WIP?
A: Open PRs are visible in your repo’s PR list and in the underlying data on /ai-adoption/data-explorer. The dashboard surfaces WIP as a count and trend.
