
Last updated: June 2026
This family answers: what is your team shipping, and how much of it is substantive work?
It is the dashboard’s “delivered output” lens — distinct from Flow (how fast?) and DORA (how reliably?). Output asks: of all the work that came out of this team this window, how does it stack up against itself over time and against the org?
The metrics
| Metric | What it captures |
|---|---|
| Output Score | The headline. Effort-weighted shipping rate per developer or per team. Replaces the older raw “Velocity” count. |
| Throughput | Raw PR count — merged PRs per week, per developer or per team. |
| Direct Commits | Commits pushed straight to a default branch without a PR. Counted as output with a configurable weight. |
| Effort Score (Complexity) | The 0.1–0.9 per-PR / per-commit complexity estimate that powers Output Score. |
Why “Output Score” replaced raw “Velocity”
The traditional metric on the developer table used to be “Velocity” — a count of merged PRs per week. It treated a one-line documentation fix the same as a 2,000-line refactor.
That worked when teams were small and the work was uniform. It broke down as soon as:
- A senior IC was working on a quarter-long feature (one giant PR = velocity of 0).
- A junior was iterating on lots of small UI changes (lots of PRs = high velocity, low impact).
- AI tools started enabling developers to ship dramatically larger changes in dramatically less time.
Output Score fixes this by weighting every PR, every direct commit, and every formal review by its estimated complexity (Effort Score, 0.1 to 0.9). A 0.9-effort PR contributes 9× the score of a 0.1-effort PR. The result is a metric that scales with the work, not the count.
How effort gets assigned
Every merged PR and every direct commit gets an Effort Score. There are two ways it can land:
auto_effort_score— an LLM-generated estimate based on the diff, title, and apparent intent. Computed by a background classifier worker. Locked to the discrete tier values {0.1, 0.3, 0.5, 0.7, 0.9}.effort_score— an optional manual override by an admin, using the same five tier values.
The displayed effort is COALESCE(effort_score, auto_effort_score, 0) — manual override wins, then LLM, then zero.
The LLM rubric is intentionally LOC-blind. Two PRs of the same line count can have very different Effort Scores if one is a copy-paste config update and the other is a careful algorithmic change.
How GitKraken Insights computes Output Score
Output Score (per developer)
  = SUM(PR effort)
  + DCWeight     × SUM(DC effort)
  + ReviewWeight × SUM(reviewed-PR effort)

Output Score (per team)
  = team total / active team developers
The three terms are:
- PR effort — the developer’s own merged PRs in the window. Each PR’s effort is
COALESCE(effort_score, auto_effort_score, 0). - DC effort — the developer’s direct commits in the window, weighted by
DCWeight(default 0.5). Settable per-org asdirect_commit_weight. - Reviewed-PR effort — the effort of PRs the developer formally reviewed (approved or requested changes), weighted by
ReviewWeight(default 0.5). Settable per-org asreview_weight. Set to 0 to disable the review-credit term entirely.
When “Exclude Chore from Output Score” is on (the default), Chore-category items are subtracted from the effort sums — but PR and commit counts shown in the cell stay raw, always reflecting true shipping volume.
When the score is rate-normalized for AI Tier (Output Norm), the per-dev sum is divided by working weeks in the window and compared to the org P90 rate. The cohort and benchmark scope widen automatically for sub-week windows so the rate still has meaningful resolution.
Read this family
Three habits:
- Read Output Score alongside Adoption Score. High Output + low Adoption = the team ships well without AI (a baseline). High Output + high Adoption = AI is paying off. Low Output + high Adoption = adoption is happening but value isn’t.
- Read team Output Score per active developer, not in absolute totals. A team of 12 will always out-ship a team of 4. The per-dev rate is the apples-to-apples comparison.
- Don’t read raw PR count when effort varies. Use Output Score when comparing developers or teams; use Throughput when comparing the same team over time (where effort distribution is roughly constant).
Where this family shows up
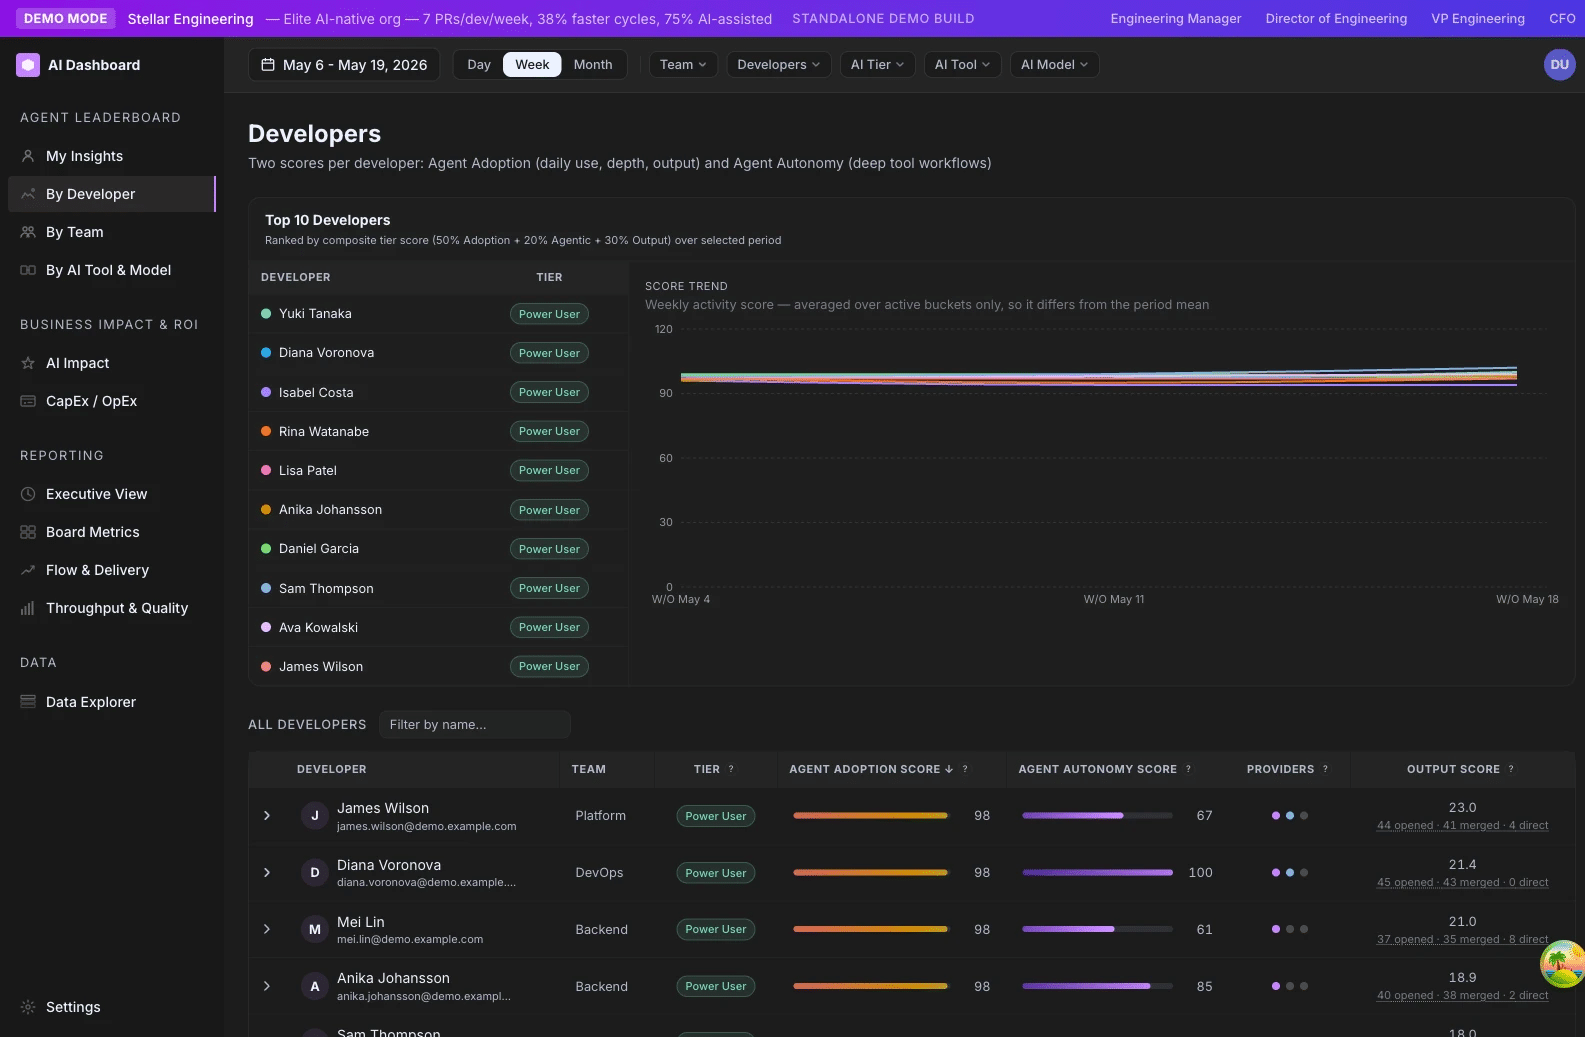
- /ai-adoption/developers — Output Score column, with a clickable opened/merged/direct breakdown that drills into the PR panel.
- /ai-adoption/teams — Output Score per active developer column.
- /ai-adoption/ai-tools-comparison — cohort comparisons use Output Score as a key metric.
- /ai-adoption/capex — Output Score with CapEx / OpEx categorization for the capitalization split.
- /ai-adoption/data-explorer — per-PR and per-commit Effort Score visible in the underlying data.
Output Score
Effort-weighted shipping rate per developer or per team. Sums the complexity of every merged PR, direct commit, and formally reviewed PR in the window, weighting commits and reviews at half the rate of authored PRs by default.
Family: Output & Throughput · Cadence: Window-based · Where it appears: /ai-adoption/developers, /ai-adoption/teams, /ai-adoption/ai-tools-comparison, /ai-adoption/capex
At a glance
Output Score replaces the older “Velocity” count on the developer table with a metric that scales with the work, not the count. Every merged PR and every direct commit carries an Effort Score (0.1 to 0.9, five discrete tiers). Output Score sums the effort across the window and credits reviewers for the PRs they formally reviewed — so a developer shipping one big architectural PR can match a developer shipping ten small fixes, and a senior who spent the window unblocking reviews still appears as a contributor.
Formula
Output Score (per developer)
  = SUM(PR effort)
  + DCWeight     × SUM(DC effort)
  + ReviewWeight × SUM(reviewed-PR effort)

Output Score (per team)
  = team total / active team developers
Where:
- PR effort =
COALESCE(effort_score, auto_effort_score, 0)summed over PRs the developer authored and merged in the window. - DC effort = same COALESCE, summed over direct commits the developer authored in the window.
- Reviewed-PR effort = same COALESCE, summed over PRs where the developer left a formal review (state
APPROVEDorCHANGES_REQUESTED). Each PR counts once per reviewer. - DCWeight = Direct Commit Weight setting (
direct_commit_weight; default 0.5; range 0–1). - ReviewWeight = Review Weight setting (
review_weight; default 0.5; range 0–1). Set to 0 to disable the review-credit term entirely. - Chore filtering — when “Exclude Chore from Output Score” is on (default), Chore-category items drop out of the effort sums (but not the displayed counts).
How GitKraken Insights calculates it
Effort scores. Every merged PR and every direct commit gets an Effort Score between 0.1 and 0.9 in five discrete tiers:
| Score | Tier | Roughly |
|---|---|---|
| 0.1 | Trivial | Typo, formatting, dependency bump |
| 0.3 | Light | Small bug fix, simple test addition |
| 0.5 | Moderate | Standard feature work, focused refactor |
| 0.7 | Substantial | Multi-component feature, non-trivial design |
| 0.9 | Deep | Architectural change, major migration |
Effort comes from an LLM classifier (auto_effort_score) and can be manually overridden (effort_score). The displayed value is the COALESCE of both.
Per-developer sum. For each developer in the window:
- Sum effort across their authored merged PRs (drafts and bots excluded; optionally Chore-excluded).
- Sum effort across their authored direct commits (bots and empty commits excluded; optionally Chore-excluded).
- Sum effort across PRs they formally reviewed (state
APPROVEDorCHANGES_REQUESTED; the same PR can credit multiple reviewers). - Multiply DC sum by
DCWeightand review sum byReviewWeight. - Add the three terms.
Team aggregate. For team rows on /ai-adoption/teams, the score is the team total divided by the count of active developers on the team. This per-active-dev rate is what makes team scores comparable across team sizes.
The Chore asymmetry. When the “Exclude Chore” toggle is on (default), Chore-category items are excluded from the effort sums — but the counts shown in the cell stay raw. So a developer who shipped 5 PRs and 12 direct commits will always show “5 PRs · 12 direct” in the breakdown, even if half were chores. This asymmetry exists so developers whose window happened to be mostly chores don’t disappear from the developer table.
Sub-week windows. For windows shorter than 7 days, the per-dev divisor uses per-row working weeks floored at a minimum, and the org P90 benchmark widens to a trailing 7-day cohort so the rate keeps meaningful resolution. Output Score itself is a raw sum and is unaffected by window length; the per-week rate-normalized variant (Output Norm, used by AI Tier) is what handles this widening.
NaN guard. If any input to the formula is NaN, Output Score returns 0.
Why it matters
Output Score is the dashboard’s answer to the chronic problem that raw PR counts mislead. A team that shipped one 0.9-effort architectural PR and a team that shipped nine 0.1-effort lint fixes should not score the same on shipping. Output Score puts them on a like-for-like footing.
The review-credit term matters for the same reason. A senior engineer who spent the window doing high-quality reviews on substantive PRs has produced real value; the older Velocity metric ignored that work entirely.
Output Score also threads cleanly into the AI Tier composite. Normalized to org P90 and scaled by Maturity Factor (we call that derived value Output Norm), it becomes the “shipping” leg of the composite alongside Adoption and Agentic.
For leaders, the most useful reading is Output Score over time alongside Adoption Score over time. AI rollouts almost always show Adoption rising first, then Output rising 4–12 weeks later.
How to read it
Output Score is a sum, not a rate, so absolute values depend on window length and team size. Some rough reads at the per-developer level for a 14-day window:
| Value | Read it as |
|---|---|
| ≥ 10 | High — multiple substantial-or-deeper PRs/commits/reviews |
| 4 – 9 | Solid — typical shipping pattern for an engaged developer |
| 1 – 3 | Light — small contributions, possibly maintenance work |
| < 1 | Minimal — investigation worthwhile (PTO? big WIP PR not yet merged? infrastructure work?) |
For teams, the per-active-dev rate is what to compare. A team averaging Output Score 7 per dev across a 14-day window is in good shape.
Where it appears
- /ai-adoption/developers — main Output Score column. The cell breakdown reads “X opened · Y merged · Z direct” and is clickable.
- /ai-adoption/teams — Output Score per active developer column, sortable, with team aggregates.
- /ai-adoption/ai-tools-comparison — cohort comparison uses Output Score as a key metric.
- /ai-adoption/capex — Output Score with CapEx vs OpEx classification for the capitalization grid.
Settings that affect it
- Direct Commit Weight — scales DC contribution (default 0.5).
- Review Weight — scales review-credit contribution (default 0.5). Set to 0 to disable the review-credit term.
- Exclude Chore from Output Score — strips Chore effort from the sums (default on).
- Maturity Factor — does not affect raw Output Score, but does affect Output Norm (the variant that feeds into AI Tier).
Related metrics
| Metric | Relationship |
|---|---|
| Effort Score | The per-PR / per-commit weights that Output Score sums over. |
| Throughput | Raw merged PR count. Use for same-team trend reading. Output Score is for cross-team comparison. |
| Direct Commits | The DC term of the formula. |
| AI Tier | Output Norm is the Output leg of the composite. |
| CapEx / OpEx Split | Categorizes the same effort sums for capitalization accounting. |
How to improve it
- Right-size PRs. A team consistently shipping 0.1–0.3 effort PRs is over-fragmenting.
- Calibrate effort scores. If the LLM-assigned
auto_effort_scoreis consistently wrong for your team’s domain, have a senior engineer override the most miscategorized PRs. - Audit Chore exclusion behavior. On most teams the default reflects the right definition of “real output.” For an SRE team where dependency upgrades are the job, turn it off.
- Track Output trajectory, not the absolute number. Output Score that climbed from 4 → 8 per dev over a quarter is a stronger signal than a static 9 from a team that has been at 9 for a year.
- Pair Output review with WIP review. A team with low Output may have a lot of work in progress that hasn’t merged.
Limitations and gotchas
- Effort is an LLM estimate, not a measurement. Manual overrides exist for the most miscategorized cases.
- The score is a sum, so window length matters. A 14-day Output Score and a 90-day Output Score are not directly comparable.
- Chore filtering changes the score, not the counts. This is intentional but trips people up.
- Direct Commit Weight or Review Weight at 0 hides that term entirely from the score.
- Bots and drafts are excluded.
FAQ
Q: Why was Velocity replaced with Output Score?
A: Velocity treated all PRs as equal-weight and ignored review work. That worked when PRs were uniform in size and scope. It stopped working as AI tooling enabled developers to ship dramatically larger changes. Output Score scales with effort, not count, and credits reviewers for substantive review work.
Q: How is Effort Score assigned?
A: An LLM classifier worker reads each PR or commit diff and assigns one of five effort tiers. The rubric ignores LOC and focuses on the change’s apparent scope, intent, and complexity. See Effort Score.
Q: Why is my Output Score 0 even though I shipped a big PR?
A: Three common causes: (1) the PR’s auto_effort_score hasn’t been computed yet, (2) the PR’s category is Chore and the “Exclude Chore” toggle is on, or (3) the PR merged outside the window you selected.
Q: Why are direct commits and reviews weighted lower than authored PRs?
A: Empirically, direct commits trend toward smaller, less-reviewed work, and a single review takes less effort than authoring the same PR. The 0.5 defaults reflect those averages. Tune via Direct Commit Weight and Review Weight.
Q: Can I see what effort score a specific PR got?
A: Yes. /ai-adoption/data-explorer → PRs tab shows the Effort column for every PR, sortable.
Throughput
Number of merged PRs in the window, expressed per week per developer for cross-team comparison.
Family: Output & Throughput · Cadence: Window-based · Where it appears: /ai-adoption/executive, /ai-adoption/ai-tools-comparison, /ai-adoption/ai-impact
At a glance
Throughput is the raw count metric — how many PRs your team merged. It is the simpler, older sibling of Output Score. Output Score is generally a better metric for cross-team or cross-window comparison because it weights for effort. Throughput is better when you want a clean count over time for the same team (where effort distribution is roughly constant) or when you need a quick gut check.
Formula
Throughput (per active dev per week) = merged PRs / active developers / weeks in window
Throughput (team total)              = SUM(merged PRs in window)
Drafts and bot-authored PRs are excluded.
How GitKraken Insights calculates it
Step 1. Count merged PRs in the window. A PR is “in the window” if its merged_at timestamp falls within [from, to). Drafts are excluded. PRs whose author GitHub login matches a bot pattern (e.g. *[bot]) are excluded.
Step 2. For team-level views, divide by the count of active developers and by the number of weeks in the window. The result is PRs per active dev per week — the comparison-ready rate.
Step 3. Per-developer Throughput is the raw count of that developer’s merged PRs in the window. The /ai-adoption/developers cell shows it as a clickable breakdown (X opened · Y merged · Z direct); clicking opens the drill-down sheet.
Who counts as “active.” An active developer for the window has is_active = true, was not fully on PTO across the window, and contributed at least one merged PR, direct commit, or formal review.
Why it matters
Two things Throughput tells you that Output Score doesn’t:
- How many distinct things shipped. If your team’s count drops while Output Score stays steady, you are shipping fewer-but-bigger PRs. That can be a good thing (right-sizing) or a bad thing (PRs growing because review queues are slow). Throughput is the signal.
- A quick gut check. Output Score requires Effort Score to be assigned, which requires the LLM classifier to have run. Throughput is computable instantly from any window of PR data.
How to read it
| Per active dev per week | Read it as |
|---|---|
| ≥ 4 | High — typical for teams shipping many small focused PRs |
| 2 – 3.9 | Solid — typical mainstream pattern |
| 1 – 1.9 | Low — investigation worthwhile (big PRs in flight? review bottleneck? infra work?) |
| < 1 | Minimal — probably either a stalled team or a deep-work team that is mid-feature |
The “right” number depends on PR size discipline. A team shipping 0.5-effort PRs comfortably runs at 4 per dev per week. A team shipping 0.9-effort PRs may live at 1 per dev per week and be just as effective.
Where it appears
- /ai-adoption/executive — Throughput as one of the headline trend lines.
- /ai-adoption/ai-tools-comparison — cohort comparisons display Throughput alongside Output Score.
- /ai-adoption/ai-impact — PR Volume trends in the System Metrics view.
Settings that affect it
None. Throughput is a raw count — no admin knobs change it. If you want effort-weighted shipping with knobs, see Output Score.
Related metrics
| Metric | Relationship |
|---|---|
| Output Score | The effort-weighted version of the same shipping activity. |
| Cycle Time | The “how fast” pair to Throughput’s “how many.” Read them together. |
| WIP | Number of currently-open PRs. Throughput is the outflow; WIP is the backlog. |
| Deployment Frequency | DORA’s release-based sibling — same concept, counted from release events instead of merges. |
How to improve it
- Right-size PRs. Teams shipping fewer-but-huge PRs often have low Throughput. The fix is usually upstream: smaller, more frequent merges. Track via Cycle Time alongside Throughput.
- Clear stale open PRs. A high WIP with low Throughput is the classic review-bottleneck pattern. Walk the oldest open PRs each week.
- Reduce review cycles. If every PR averages 2+ “changes requested” rounds, Throughput stalls. See Review Cycles.
Limitations and gotchas
- Raw counts are misleading for cross-team comparison. A team merging 20 0.1-effort docs PRs per week looks more productive than a team merging 3 0.9-effort migration PRs per week. Use Output Score instead when comparing.
- Throughput drops during long features. Teams working on multi-week initiatives may legitimately show low Throughput. Pair with WIP to distinguish “stuck” from “deep-work.”
- Bots are excluded. Dependabot, security bots, and similar tools don’t inflate Throughput.
FAQ
Q: Why two metrics for shipping (Throughput + Output Score)?
A: They answer different questions. Throughput is “how many?” Output Score is “how much real work?” Both are useful; neither alone is sufficient.
Q: A team has high Throughput but low Output Score. What does that mean?
A: They are shipping many small things. That is fine for some work (UI iteration, bug fixes) and a warning sign for others (a backend team should usually have substantial PRs in the mix).
Q: Does the count include PRs that were merged but reverted?
A: Yes. Reverts are tracked as a separate signal but don’t subtract from Throughput in the standard view.
Direct Commits
Commits pushed straight to a default branch without a PR. Counted alongside merged PRs as shipped work, with a configurable weight.
Family: Output & Throughput · Cadence: Window-based · Where it appears: /ai-adoption/developers, /ai-adoption/teams, /ai-adoption/capex, /ai-adoption/data-explorer
At a glance
Not all shipped work goes through a pull request. Some teams (especially those running Trunk-Based Development) push directly to main or master for hotfixes, dependency upgrades, or any change small enough to bypass review. The Direct Commits column captures that activity so developers who do real work this way still appear in the dashboard’s output metrics.
Each direct commit carries an Effort Score (0.1 to 0.9) just like a PR. It is added to Output Score, scaled down by the Direct Commit Weight setting (default 0.5).
Formula
Direct Commit contribution to Output Score = DCWeight × SUM(DC effort)

  DC effort = COALESCE(effort_score, auto_effort_score, 0) per commit
  DCWeight  = Direct Commit Weight setting (default 0.5)
How GitKraken Insights calculates it
What counts as a direct commit. A commit pushed to a default branch (main, master, or the repo’s configured default) whose author is one of your roster developers and whose author is not a bot (login matching *[bot]). Empty commits are excluded.
Effort Score. Every direct commit gets an Effort Score from the LLM classifier (auto_effort_score) using the same five-tier rubric as PRs. Manual overrides are supported (effort_score). The displayed value is COALESCE(effort_score, auto_effort_score, 0).
Aggregation. Per-developer direct-commit effort sums separately from PR effort. The two sums are then combined in the Output Score formula with DCWeight applied to the DC sum.
Chore handling. If the “Exclude Chore from Output Score” toggle is on (default), Chore-category direct commits are removed from the effort sum but their count is preserved in the displayed breakdown.
Why it matters
Direct commits used to disappear from productivity dashboards entirely because the dashboards assumed every shipped change went through a PR. That made developers running TBD workflows look low-output even when they were shipping meaningfully. By counting direct commits — weighted appropriately — we close that gap.
The 0.5 default reflects empirical reality: direct commits skew smaller and less-reviewed than PRs. Treating them at 1:1 with PRs would over-credit pure direct-commit workflows; treating them at 0 would erase a legitimate work pattern.
How to read it
Don’t read direct commits in isolation — read them as part of the Output Score breakdown. The /ai-adoption/developers cell shows the count as part of “X opened · Y merged · Z direct.”
| Pattern | What it suggests |
|---|---|
| Most output is PRs | Standard PR-based workflow |
| Roughly equal PR and direct work | Mixed workflow, often platform or SRE teams |
| Mostly direct commits | Trunk-Based Development, or a hotfix-heavy week |
| Direct commits rising sharply | Investigate — could be legit TBD adoption or could be PRs being bypassed |
Where it appears
- /ai-adoption/developers — Direct Commits count in the Output Score breakdown cell.
- /ai-adoption/teams — per-team direct-commit counts inside the developer sub-table.
- /ai-adoption/capex — direct commits carry CapEx vs OpEx categorization the same as PRs.
- /ai-adoption/data-explorer — Direct Commits tab shows every commit with full metadata.
Settings that affect it
- Direct Commit Weight — the multiplier. 0 = ignore direct commits in Output. 1 = treat equally to PRs.
- Exclude Chore from Output Score — affects whether Chore-category direct commits contribute to the effort sum.
Related metrics
| Metric | Relationship |
|---|---|
| Output Score | Direct commits are the DC term of the formula. |
| Effort Score | Each direct commit gets one. |
| Throughput | Throughput counts PRs only; direct commits live in this metric. |
How to use the weight
- Lower it (toward 0) if your team uses direct commits primarily for trivial maintenance and you don’t want them inflating Output Score.
- Raise it (toward 1) if your team runs TBD and most substantive work goes via direct commit.
- Leave at 0.5 if you have a mixed workflow — this is the empirically-tuned default.
Limitations and gotchas
- Bot commits are excluded. Dependabot’s auto-merged dependency commits, security-bot patches, and similar don’t contribute.
- Force-pushed history is whatever GitHub reports last. If a developer rewrites direct-commit history via force-push, the displayed count reflects post-rewrite history.
- Co-authored commits attribute to the primary author. GitHub’s Co-authored-by trailer doesn’t fan out into multiple developer scores.
- The classifier may lag. A direct commit pushed in the last hour may not have an Effort Score yet, so its contribution to Output Score is temporarily 0.
FAQ
Q: Why are direct commits weighted lower than PRs?
A: Most direct commits are smaller and less-reviewed than typical PRs. The 0.5 default reflects that. If your team’s direct-commit work is substantive, raise the weight.
Q: A developer’s commits aren’t showing up. Why?
A: Most likely their is_active is false, or their GitHub login on the roster doesn’t match the actual commit author. Check Settings → Developers.
Q: Do reverts count as direct commits?
A: Yes — they are commits pushed to the default branch, so they appear in the count. The Effort Score classifier usually labels them low-effort.
Effort Score (Complexity)
A 0.1–0.9 estimate of how complex each PR and direct commit is. Five tiers, LLM-generated, manually overrideable. Powers Output Score.
Family: Output & Throughput · Cadence: Per PR / per commit, continuously classified · Where it appears: /ai-adoption/data-explorer, drill-down tables, /ai-adoption/developers (via Output Score)
At a glance
Every merged PR and every direct commit in GitKraken Insights carries an Effort Score — a number between 0.1 and 0.9 representing the change’s apparent complexity. There are five discrete tiers (Trivial / Light / Moderate / Substantial / Deep). The score is assigned by an LLM classifier that reads the diff, the title, and the PR description; it ignores raw line count.
Effort Scores are the per-item weights that feed Output Score. They are also exposed directly in tables and drill-downs as a sortable “Complexity” pill.
The rubric
| Score | Tier | Examples |
|---|---|---|
| 0.1 | Trivial | Typo fix, formatting-only changes, dependency version bump, lint config tweak |
| 0.3 | Light | Small bug fix, simple test addition, copy update with no logic, isolated config change |
| 0.5 | Moderate | Standard feature work, contained refactor, new endpoint, focused integration |
| 0.7 | Substantial | Multi-component feature, non-trivial design decision, cross-module refactor, schema migration |
| 0.9 | Deep | Architectural change, major migration, deep algorithmic work, new system bootstrap |
The rubric is intentionally LOC-blind. Two PRs of identical line count can have very different Effort Scores if one is a copy-paste config update and the other is a careful algorithmic change. A 50-line PR can be 0.9 (deep algorithmic) while a 2,000-line PR can be 0.1 (auto-generated dep bump).
How GitKraken Insights calculates it
Step 1 — auto_effort_score (LLM). A background worker reads each PR or commit through the classifier. The classifier looks at the diff (what files, what changed), the PR or commit title, the PR description (if any), and the branch name (signals like feat/, fix/, chore/).
It outputs one of the five tier values. The classifier is rubric-versioned (EffortScoreRubricVersion), so when the rubric is updated, the system knows to reclassify.
Step 2 — effort_score (manual override). Admins can override auto_effort_score with their own assessment from /ai-adoption/data-explorer. Manual overrides win the COALESCE.
Step 3 — the displayed value. Every read uses COALESCE(effort_score, auto_effort_score, 0). So manual > LLM > zero.
The effort pass is independent of categorization. Effort runs on its own state gate, decoupled from classification_status. Category overrides (e.g. marking a PR as Chore) don’t blank out effort, and rubric bumps don’t blank out the category.
Retry behavior. The effort classifier retries up to three times per PR on transient failures. If all three fail, the PR is left without an effort score until the next refresh sweep.
Why it matters
Effort Score is the single mechanic that lets Output Score work. Without it, the dashboard would be back to raw PR counts and the well-known “Velocity is misleading” problem. With it: a senior IC shipping one 0.9-effort PR matches a junior shipping nine 0.1-effort PRs in Output Score; cross-team comparison stops penalizing teams whose work is structurally larger-grained; AI-enabled “one developer shipping 3× more substantive work” patterns show up in Output Score where they wouldn’t in raw counts.
Effort Score is also a useful standalone metric. Look at the distribution across a team’s PRs — a team that ships only 0.1–0.3 effort is probably over-fragmenting. A team that ships only 0.7–0.9 effort is probably not breaking work down enough for clean review.
Where it appears
- /ai-adoption/data-explorer — PRs tab and Direct Commits tab. Sortable “Effort” column with a five-tier pill (Trivial → Deep).
- PR drill-down tables — when you click into a cycle-time or PR-volume chart point, the resulting table has an Effort column.
- /ai-adoption/developers — feeds into Output Score; not displayed per-PR in the developer table.
- /ai-adoption/teams — feeds into Output Score; not displayed per-PR in the team table.
Settings that affect it
There are no admin-configurable settings for Effort Score directly. The rubric is versioned in code; rubric changes are rolled out via a coordinated reclassification pass. Manual override exists per item from /ai-adoption/data-explorer — that is effectively the per-PR setting.
Related metrics
| Metric | Relationship |
|---|---|
| Output Score | Sums Effort Score over a developer’s merged PRs, direct commits, and formal reviews. |
| Direct Commits | Each direct commit gets an Effort Score. |
| Throughput | The count-only sibling. Throughput doesn’t use Effort. |
How to use Effort Scores
- Audit miscategorized PRs. Once a quarter, open /ai-adoption/data-explorer sorted by Effort descending. Skim the 0.9s. Are they actually deep work, or is the LLM over-scoring something? Same in reverse with 0.1s — anything that looks substantive at 0.1 deserves an override.
- Watch the team distribution. /ai-adoption/data-explorer filtered to a team shows the Effort histogram. Heavy left-skew (everything 0.1–0.3) suggests over-fragmentation. Heavy right-skew (everything 0.7+) suggests undersized review batches.
- Don’t game it. Tempting as it is to manually mark every PR as 0.9 to inflate Output Score, this defeats the cross-team comparison. The defaults are calibrated; if your team’s actual work is mostly 0.5, the score will reflect that, and that is fine.
Limitations and gotchas
- It is an LLM estimate, not a measurement. Expect 70–80% directional accuracy; the rest is rubric-edge cases.
- The classifier doesn’t see review feedback. A PR that looked like 0.3 work but actually exposed an architectural issue during review still scores 0.3. The effort is the work as merged, not the discussion that produced it.
- Bot PRs aren’t classified. They are excluded from Output Score anyway.
- Rubric versioning means old PRs may rescore. When the rubric is bumped (rare), a refresh sweep reclassifies recent PRs.
FAQ
Q: How do I override a wrong score?
A: /ai-adoption/data-explorer → PRs tab → click the row → edit the Effort field. Saves immediately; takes effect on the next Output Score recomputation.
Q: Why discrete tiers instead of a continuous 0–1 score?
A: Discrete tiers reduce noise (the LLM can pick between 5 buckets more consistently than along a continuous slider) and they make manual overrides intuitive.
Q: Is 0.9 the maximum? Can a really gnarly PR be 1.0?
A: 0.9 is the maximum tier. We cap there because the linear sum (Output Score) becomes too sensitive to individual high-effort outliers above that.
Q: Why ignore LOC?
A: Lines changed correlates poorly with effort. A 5,000-line PR can be a near-trivial mechanical refactor; a 30-line PR can be a deep algorithmic change. Including LOC in the rubric made the score worse, not better, in our calibration.
