Agent Adoption Score
A 0–100 measure of how consistently and how deeply a developer is using AI coding tools (Claude Code, Codex, Cursor) over the selected window.
- Range
- 0 – 100
- Family
- Adoption & Agentic
- Cadence
- Window-based (refreshes with date range)
At a glance
The Agent Adoption Score is the dashboard’s headline answer to “is this developer using AI?” It’s a single number from 0 to 100 that combines four dimensions of usage — daily consistency, time-of-day spread, prompt volume, and output tokens — across all the AI tools the developer has access to. Higher means more consistent, deeper use; lower means sporadic or shallow use. It’s normalized against your organization’s own 90th-percentile usage, so the bar is your team, not some industry average.
Formula
Adoption Score = min(Primary + 0.25 × Cursor, 100) × Maturity Factor

  where Primary = four-factor blend of Claude ∪ Codex
        Cursor  = four-factor blend of Cursor (added if non-null)
The four factors per provider, each capped at the org’s P90 and weighted into the 100-point scale, are:
- Daily Use — weekdays with ≥1 event / effective weekdays
- Hourly Spread — avg distinct hours per day with ≥2 prompts / org P90 spread
- Prompts — prompts per weekday / org P90 prompts
- Output Tokens — output tokens per weekday / org P90 tokens
How GitKraken Insights calculates it
Per-provider scoring
For each provider (Claude Code, Codex, Cursor), we compute four normalized factors:
- Daily Use: the fraction of effective weekdays in the window where the developer had at least one AI event. Effective weekdays subtracts weekdays before the provider was instrumented (Claude Code data starts March 5, 2026) and subtracts PTO weekdays.
- Hourly Spread: the average number of distinct hours per active weekday where the developer ran ≥2 prompts. Captures “AI is integrated into their workday” vs. “AI is one batch at the end of the day.”
- Prompts: total prompts divided by active weekdays.
- Output Tokens: total output tokens divided by active weekdays. A proxy for the depth of each AI interaction.
Each factor is divided by the corresponding org P90 cap (the 90th-percentile value across all active developers in the window) and capped at 1.0. So a developer at the org’s 90th percentile or above on a factor scores the max contribution for that factor.
The four normalized factors are then weighted (DailyUse, HourlySpread, Prompts, Output) and summed to a 0–100 provider score.
Union Claude + Codex into the Primary score
We don’t average the two providers — we union their events at the factor level. A developer using Claude in the morning and Codex in the afternoon gets credit for the combined daily spread, not two separate fractional scores. This avoids penalizing devs who use multiple tools.
Add the Cursor boost
If the developer has Cursor data, we compute their Cursor score independently and add it to the Primary at a 25% rate (configurable via the
SCORE_SECONDARY_BOOSTenv var). The total is capped at 100 before maturity scaling.Scale by Maturity Factor
The final value is multiplied by the org’s Maturity Factor (default 0.75). At the default setting, a developer at the org’s P90 on every factor scores 75 — leaving headroom to grow into the Power User band (≥80).
Window scope. Everything is scoped to the date range selected at the top of the page. The org P90 caps are recomputed for the same window, so the ceiling moves with the cohort.
Why it matters
Adoption is the leading indicator of an AI rollout. Output follows adoption with a 4–12 week lag — first developers have to integrate the tool, then they have to get good at it, then they ship faster. Reading the Adoption Score in isolation tells you whether your rollout is moving. Reading it alongside Output Score over time tells you whether the rollout is paying off.
The score is descriptive, not evaluative. A senior developer working on a quarter-long migration may show as Emerging because the work doesn’t suit AI tooling. A junior on UI changes may be a Power User. Neither is a judgment of skill. The aggregated score across a team or a cohort is the more useful read.
How to read it
- 80–100Power User — AI is integrated into daily work, used across multiple sessions per day
- 55–79Regular — solid, consistent adoption; AI is a routine part of their workflow
- 25–54Explorer — using AI but not yet daily, or shallow integration
- 0–24Emerging — minimal or no AI usage in the window
These tier bands are fixed reference points — they do not move with the Maturity Factor. What moves is the score: the Maturity Factor sets the ceiling (Maturity Factor × 100), so at the default 0.75 the highest achievable score is 75 — the top of Regular — and the Power User band (≥ 80) only opens up as you raise the Maturity Factor toward 1.0. See Maturity Factor for how to size it.
A team average of 50–65 means a healthy mix with most developers in Explorer/Regular. At the default 0.75 Maturity Factor, a team average approaching the 75 ceiling means broad, deep adoption across the team — you raise the Maturity Factor before the Power User band fills in. A team average below 30 is your “rollout has stalled” signal.
Settings that affect it
- Maturity Factor — multiplies the final score. Lowering it lowers the tier ceiling for everyone.
- Cursor secondary boost (env var
SCORE_SECONDARY_BOOST, default 0.25) — how heavily Cursor contributes alongside Claude / Codex. - Provider weights (env vars
SCORE_WEIGHT_*) — how much DailyUse / HourlySpread / Prompts / Output each contribute within a provider’s score.
The four-factor weighting per provider is not currently exposed in the Settings UI. Ask your account manager if you need it tunable.
How to improve it
- Run scheduled “AI office hours.” Pair a Power User with an Emerging developer for an hour. Watch the Emerging developer’s Adoption climb in the next two-week window.
- Set provider defaults. Make sure new developers have Claude Code installed and configured on day one. Emerging numbers among recent hires often trace to “no one told me to install it.”
- Audit the Emerging cohort. Open /developers, sort by Adoption ascending. Walk the list. Many “Emerging” devs are actually working on infrastructure or platform work where AI isn’t helpful — those are not a problem. Some are stuck on tooling friction. Those are the wins.
- Track adoption trajectory, not snapshot. A developer who moved from Emerging → Explorer in 6 weeks is a win even if they’re still below 50.
- Lower the Maturity Factor while rolling out. At 0.6, more developers feel like they’re making progress as Explorer / Regular. Once you’re 6+ months in, raise it back to 0.75 or higher.
Limitations and gotchas
- The score lags reality by hours, not days. Events sync every few minutes but with a 12-hour safety lag to absorb late-arriving OTEL backfill.
- Pre-2026-03-05 Claude Code data doesn’t exist. Effective Weekdays adjusts for this automatically.
- Cursor data depends on the Cursor API being reachable. If your Cursor sync is broken, devs who only use Cursor will show as Emerging.
- The org P90 ceiling moves with the cohort. Hire a wave of Power Users and the bar rises for everyone. This is intentional but counter-intuitive.
- Direct provider events only. We don’t infer AI usage from PR co-author tags or other heuristics for the Adoption Score (that’s AI-Assisted Percentage).
FAQ
Why don’t Claude and Codex scores get averaged together?
Because averaging penalizes developers who use multiple tools. A dev who uses Claude in the morning and Codex in the afternoon should get full daily-use credit. Unioning the events at the factor level achieves that cleanly.
A developer shows score 0 but I know they’re using Claude. What happened?
Check (1) the developer’s is_active flag, (2) whether their email aliases are mapped if they have multiple work emails, and (3) whether the date range pre-dates the provider’s data start (March 5, 2026 for Claude). One of those almost always explains it.
Why does Cursor count for less than Claude Code or Codex?
Cursor’s event stream is more sparse and less structured than the OTEL exports from Claude / Codex. We use it as confirmatory signal rather than primary evidence — hence the 25% boost rate. Adjustable via env var.
Can I see the four-factor breakdown for a single developer?
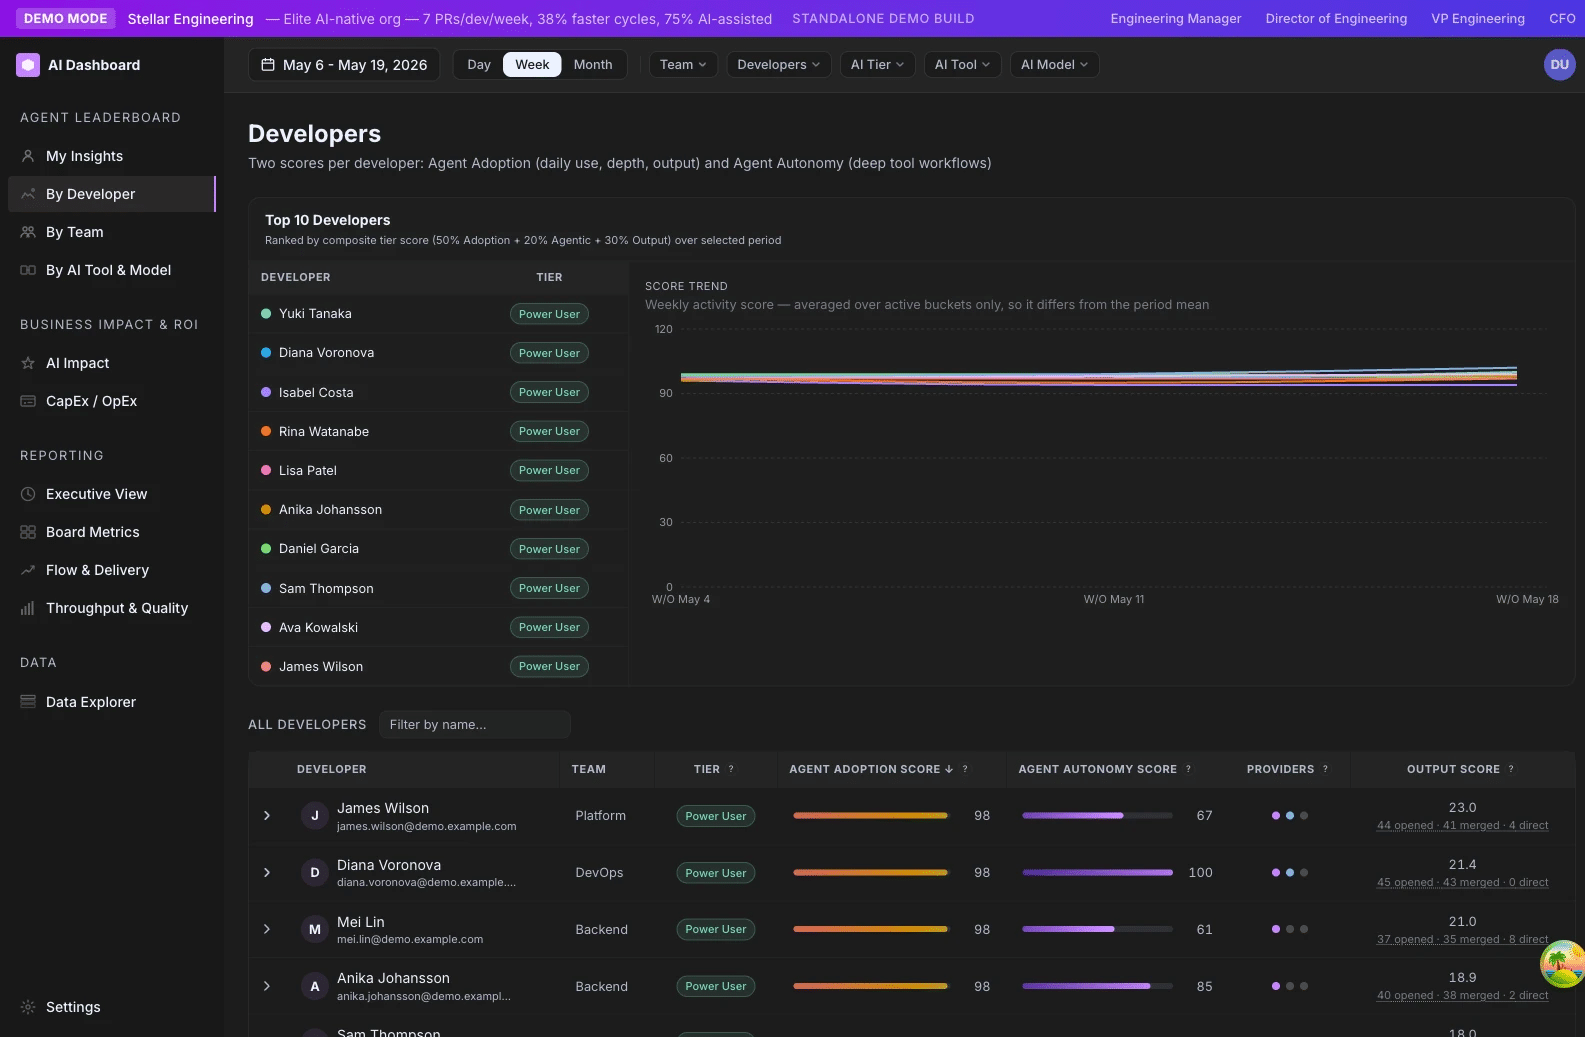
Yes. Click any developer on /developers to expand them. The agentic panel shows DailyUse, HourlySpread, Prompts, and Output as bars with the developer’s value and the org P90 cap.
Related metrics
| Metric | Relationship |
|---|---|
| Agent Autonomy Score | Parallel metric. Adoption captures consistency; Autonomy captures depth of autonomous use. |
| AI Tier | Adoption is one of three inputs into the composite Tier. |
| Maturity Factor | The scalar that ceilings every Adoption Score in your org. |
| Cursor Boost | Defines how Cursor adoption contributes to the headline Adoption Score. |
| Output Score | The shipping-side metric. High Adoption with flat Output is a common pattern in early rollouts. |
Where it appears
/developersprimary surface. Headline column on the developer table, plus an expanded panel showing the four-factor breakdown and the per-provider contribution (Claude vs. Codex vs. Cursor)./teamsteam average column on the main table; expandable rows show per-developer scores./comparisondistribution by cohort (e.g. by team, by AI tool, by primary model)./executivehero KPI card “AI Adoption %” (percentage of devs at score ≥ 25) and a trend line./ai-impactused as the cohort dimension for the productivity uplift analysis.