AI Tier
The composite category — Power User, Regular, Explorer, Emerging, or On PTO — that every developer is sorted into. Blends adoption consistency, autonomous use, and effort-weighted shipping into a single tier.
- Family
- Adoption & Agentic
- Cadence
- Window-based
At a glance
The AI Tier is the dashboard’s headline classification — every active developer lands in one of five tiers each window. It’s a deliberate composite of three signals: how consistently the developer is using AI (Adoption), how autonomously (Agentic), and how productively (Output Norm). The weights are configurable per-org in Settings → General (defaults 0.5 / 0.2 / 0.3) — see “The weighted blend” below.
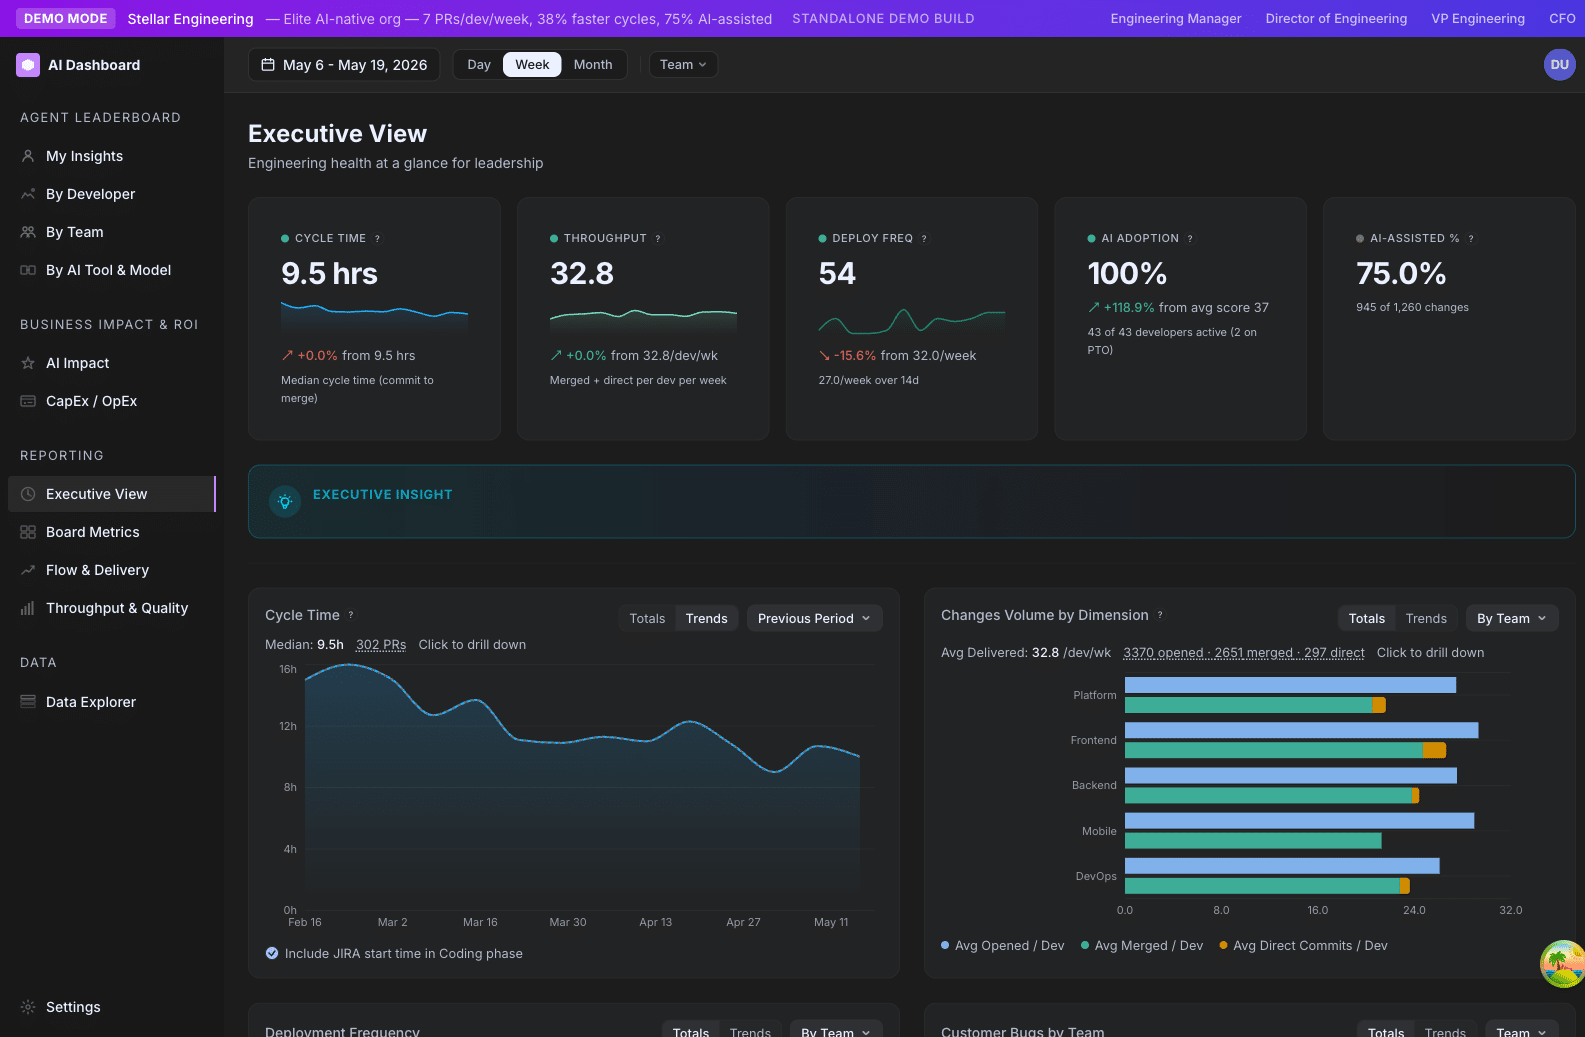
The tier is what drives the Top 10 widget, the executive ranking, the breakdown charts that bucket by AI Tier, and the team-level tier mix bars on /ai-adoption/teams. If you only learn one composite metric in the dashboard, learn this one.
Formula
composite = wAdoption × Adoption + wAgentic × Agentic + wOutput × OutputNorm

where weights are renormalized to sum to 1.0
defaults: 0.5 / 0.2 / 0.3

Tier:
  ≥ 80     →  Power User
  55 – 79  →  Regular
  25 – 54  →  Explorer
  < 25     →  Emerging
  PTO      →  On PTO (override)
How GitKraken Insights calculates it
The three inputs.
- Adoption — the developer’s Agent Adoption Score, 0–100.
- Agentic — the developer’s Agent Autonomy Score, 0–100 (Claude Code + Codex sessions only; Cursor excluded).
- Output Norm — a normalized version of the developer’s Output Score. Computed as
min(devRate / OrgP90Rate, 1.0) × 100 × MaturityFactor, wheredevRate = OutputScore / weeks. Capped at 1.0 before scaling so outlier shippers don’t blow past 100.
All three are already on the same 0–100 scale, and all three are already scaled by the Maturity Factor. They’re directly comparable.
The weighted blend. The three weights — Adoption / Agentic / Output — are stored per-organization in analytics.app_settings under the keys tier_weight_adoption, tier_weight_agentic, and tier_weight_output. Defaults are 0.5 / 0.2 / 0.3. They’re stored raw, then renormalized to sum to 1.0 on every read. So 0.5 / 0.2 / 0.3 renormalizes to 0.5 / 0.2 / 0.3 (already sums to 1); 1.0 / 0.5 / 0.5 renormalizes to 0.5 / 0.25 / 0.25.
Where to change them. The Settings → General form exposes tier weights alongside maturity_factor, developer_hourly_rate, baseline_period_start, and default_department. Edit the tier_weight_* values there and the change takes effect on the next read.
If you set all three weights to zero (or negative), we fall back to defaults rather than producing a NaN. There’s never a “100% output, 0% everything else” boost run.
Classification. Once the composite score is computed, it’s mapped to a tier: 80+ = Power User, 55–79 = Regular, 25–54 = Explorer, <25 = Emerging. The Emerging label is used consistently across the backend enum, the UI badge, the onboarding tour, and the Top-10 widget.
The PTO override. If a developer was on PTO for every weekday in the selected window, they’re forced to the On PTO tier regardless of underlying scores. PTO override is checked first — if ptoFlag is true, we return (0, OnPTO) immediately and skip the composite math.
Window length matters. If the selected window is less than 7 days, the Output Norm is forced to zero (rates can’t be computed over sub-week windows). Tier still works in that case, but it’s effectively a 2-input composite for short windows.
Org P90 is always org-wide. Just like Adoption and Agentic, the Output Norm benchmark is computed across the whole active org, not the team you’re filtering to. A developer’s tier doesn’t change when an admin toggles team filters.
Why it matters
The Tier is the dashboard’s most-used metric for cohort comparison and trend reading. It’s the answer to questions like:
- “What percent of our org is at Regular or above?” — your AI rollout maturity score
- “How does our backend team’s tier mix compare to the mobile team?” — find adoption gaps
- “How many developers crossed from Explorer → Regular last quarter?” — measure rollout velocity
A single developer’s tier is not a performance evaluation. The cohort is the unit of analysis.
How to read it
The tier mix — what percent of your population is in each tier — is more informative than any single tier label. A healthy org in the middle of an active rollout looks like:
- Power User10–25%
- Regular30–50%
- Explorer20–35%
- Emerging10–20%
- On PTO<5% typical, up to 15% in heavy-vacation months
If your Power User % is below 5%, your rollout has stalled or your org is genuinely early — check whether Maturity Factor is appropriate.
If your Emerging % is above 25%, you have an onboarding or tooling-friction problem.
If On PTO % is unusually high (>15%), check whether your PTO sync is working.
Settings that affect it
- Maturity Factor — scales all three inputs, so it shifts the entire population up or down the tier ladder. Configurable in Settings → General.
- Tier Weights — controls how much Adoption / Agentic / Output each contribute. Defaults 0.5 / 0.2 / 0.3. Per-org in
app_settings; editable in Settings → General. - Direct Commit Weight — affects Output Score, which feeds into Output Norm. Per-org in
app_settings; editable in Settings → General. - Exclude Chore from Output Score — same path through Output. Per-org in
app_settings; editable in Settings → General.
How to improve it
- To move developers from Emerging → Explorer, focus on Adoption. See Playbook — Roll out AI tooling with the Adoption Score.
- To move developers from Regular → Power User, focus on Agentic and Output together. The top tier requires both depth of AI use and shipping at the org’s top rate.
- To shift the org-level tier mix without retraining anyone, tune the Tier Weights. Moving the weights toward Output emphasizes shippers; moving them toward Adoption emphasizes consistent users. (Editable in Settings → General.)
- To grade fairly across teams of different sizes, look at tier mix percentage rather than absolute counts.
Limitations and gotchas
- Org P90 moves. A developer with steady absolute numbers can drop a tier when the rest of the org catches up.
- Sub-7-day windows. Output Norm forces to zero, so Tier in a 5-day window is effectively Adoption + Agentic only.
- Composite hides imbalance. A developer at Adoption=90 / Agentic=30 / OutputNorm=30 has the same composite (~60, Regular) as one at 50/50/50. Always look at the expanded breakdown.
- PTO override is binary. Partial-PTO developers (e.g. 2 weeks of a 4-week window) get no override.
- Tier thresholds are fixed. The 25/55/80 cutoffs don’t move when you change Maturity Factor — only the inputs do.
FAQ
Why a weighted composite instead of just averaging Adoption + Agentic + Output?
Different orgs value different signals. An early-stage rollout cares mostly about Adoption. A mature org cares mostly about Output. The weighted composite lets you tune which signal drives the Tier.
What does “On PTO” do to team averages?
On-PTO developers are excluded from average score, Power User %, active-adoption %, and the Top 10. They’re still in the roster, just not in those aggregates.
Can a single developer’s tier change just because the org changed?
Yes. Tier is normalized to the org P90 for Output, and the P90 caps for Adoption / Agentic are also org-wide.
I set Tier Weights to 0.7 / 0.0 / 0.3 — what happens to Agentic?
Agentic is silently weighted at 0 in the composite. Renormalization still works. Agentic Score still displays separately on the developer detail panel.
Related metrics
| Metric | Relationship |
|---|---|
| Agent Adoption Score | Input #1. Default weight 0.5. |
| Agent Autonomy Score | Input #2. Default weight 0.2. |
| Output Score | Input #3 (via Output Norm). Default weight 0.3. |
| Maturity Factor | Scales all three inputs uniformly. |
Where it appears
/ai-adoption/developersprimary surface. Tier badge on every row, sortable column./ai-adoption/teamstier mix bars on every team row./ai-adoption/executiveadoption tier bar (clickable tier labels deep-link into /ai-adoption/developers filtered to that tier)./ai-adoption/ai-tools-comparisoncohort comparisons use tier as a key segmentation./ai-adoption/ai-impactproductivity analysis uses tier as the primary cohort dimension.