For Team Leads
Last updated: September 2026
You run one team day-to-day. You want a pulse on flow, blockers, and review health. This page is your weekly toolkit.
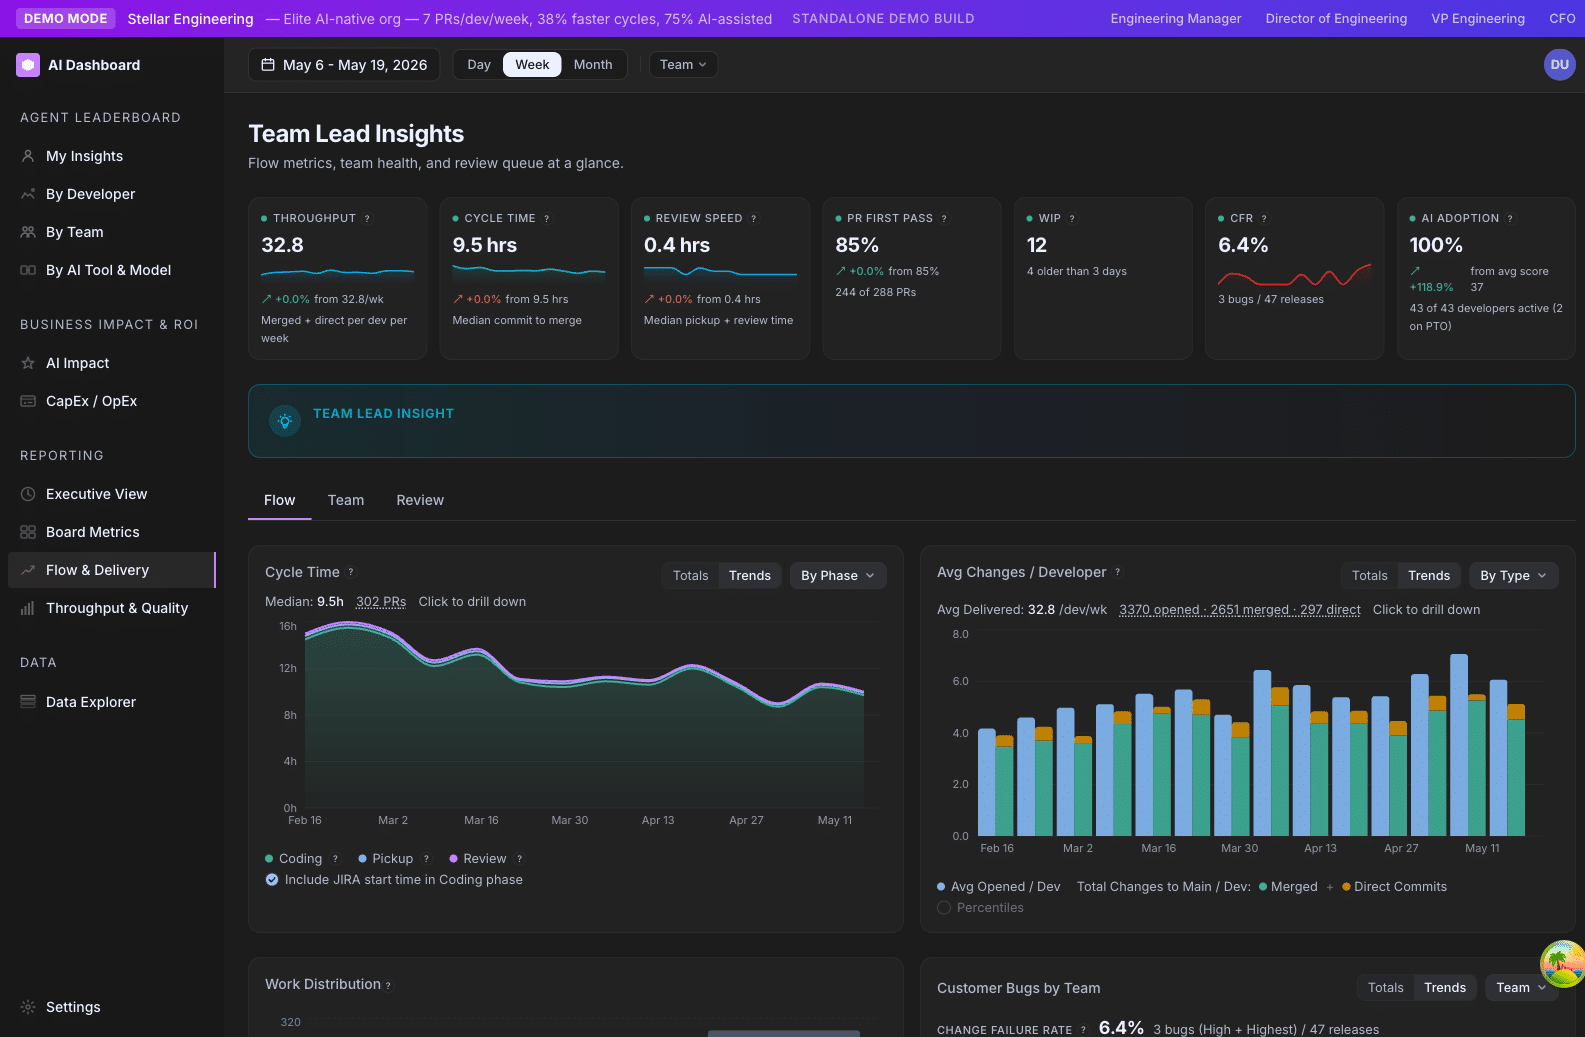
Your weekly home: /ai-adoption/teams
Open /ai-adoption/teams with the date range set to the last 14 days. The team table is your dashboard. Expand your team’s row and you get a per-team detail view with the three things you care about:
- Per-developer roster — Adoption Score, Output Score, AI Tier, and direct commits for every developer on the team. A clickable Tier badge surfaces the live tier composite for each person.
- System Metrics — Cycle Time and PR Volume trends with a dimension dropdown (Phase, Author, AI Tier, PR Category). The Cycle Time phase breakdown is where you spend most of your time.
- Repos — per-repo readiness scores. Useful when one specific repo is dragging your team’s Readiness down.
Drill into deeper analyses on /ai-adoption/ai-impact:
- Cycle Time breakdown with Totals / Trends toggle and a phase-by-phase trend.
- PR Volume by Effort, Category, Author, or AI Tier.
- Review Cycles bucketed (0 / 1 / 2 / 3+).
- WIP trend.
- CFR card and trend (if Jira is wired up).
What to look at when
The metrics that matter most for a team lead, in priority order:
| Metric | Where | Why you care |
|---|---|---|
| Cycle Time phase breakdown | /ai-adoption/teams (expanded) or /ai-adoption/ai-impact | Tells you which phase is your bottleneck. Almost always more useful than the total. |
| Review Cycles | /ai-adoption/ai-impact (PR Volume → dimension) | A creeping bucket distribution (more 2s and 3+s) means PRs are getting too big or specs are too thin. |
| First-Pass Rate | /ai-adoption/ai-impact | The clean-merge percentage. A rising number is a strong code-quality signal. |
| WIP | /ai-adoption/ai-impact | If WIP is rising while Throughput stays flat, your review queue is the constraint. |
| AI Adoption | /ai-adoption/teams (per-team) and /ai-adoption/developers (per-person) | Compare to peer teams of similar size and maturity, not to an absolute number. |
| CFR | /ai-adoption/ai-impact | If your team is shipping fast, watch CFR alongside to make sure quality isn’t slipping. |
A useful weekly ritual
A 15-minute Monday review:
- Open
/ai-adoption/teamsand expand your team. Note anything visibly off — a Readiness gone red, an Output Score down 30% week-over-week, an unfamiliar developer in the roster. - Open the Cycle Time phase breakdown. Which phase is biggest? If Pickup dominates, your review queue is the problem and you need a clearing ritual. If Review dominates, your PRs are too big. If Coding dominates, look at WIP and developer-level activity for stalled work.
- Walk your team’s open PR queue in your repo’s native PR list. Look at the oldest 5. For each, decide: ship, deadline, or close.
- Spot the outlier. Did anyone have a noticeably high or low Output Score this week? Five-second mention to yourself, not a public callout. Worth a check-in if it persists into next week.
That is it. Closing five stale PRs per week is the single highest-leverage flow improvement most teams can make.
How to interpret the numbers fairly
A few rules of thumb:
| Metric | Rule of thumb |
|---|---|
| Cycle Time | Under 24h is excellent for small teams. 1–3 days is fine. 4+ days deserves investigation. |
| First-Pass Rate | 60–80% is healthy. Higher than 85% can mean reviewers are rubber-stamping. Lower than 50% means PRs are too big or specs are too thin. |
| Review Cycles | Average 0–1 is healthy. 2+ usually means PRs are too big. |
| WIP | Rule of thumb: 1.5–2× the number of active developers. If your team of six has 25 open PRs, you have a WIP problem. |
| AI Adoption | Compare to other teams of similar size and maturity, not to an absolute number. |
These are starting points, not laws. Your team’s context can move the bar.
What the dashboard won’t tell you
- Whether a specific PR is good or bad. Look at the PR.
- Whether a developer is happy. Talk to them.
- Whether your team is overloaded. WIP gives a hint, but the truth lives in your standup and retro.
Where to drill further
- A specific cycle time problem → Playbook — Investigate a slow cycle time
- A spike in customer bugs → Playbook — Interpret a high CFR week
- A developer struggling with adoption →
/ai-adoption/developers, filter to that person, expand the heatmap.