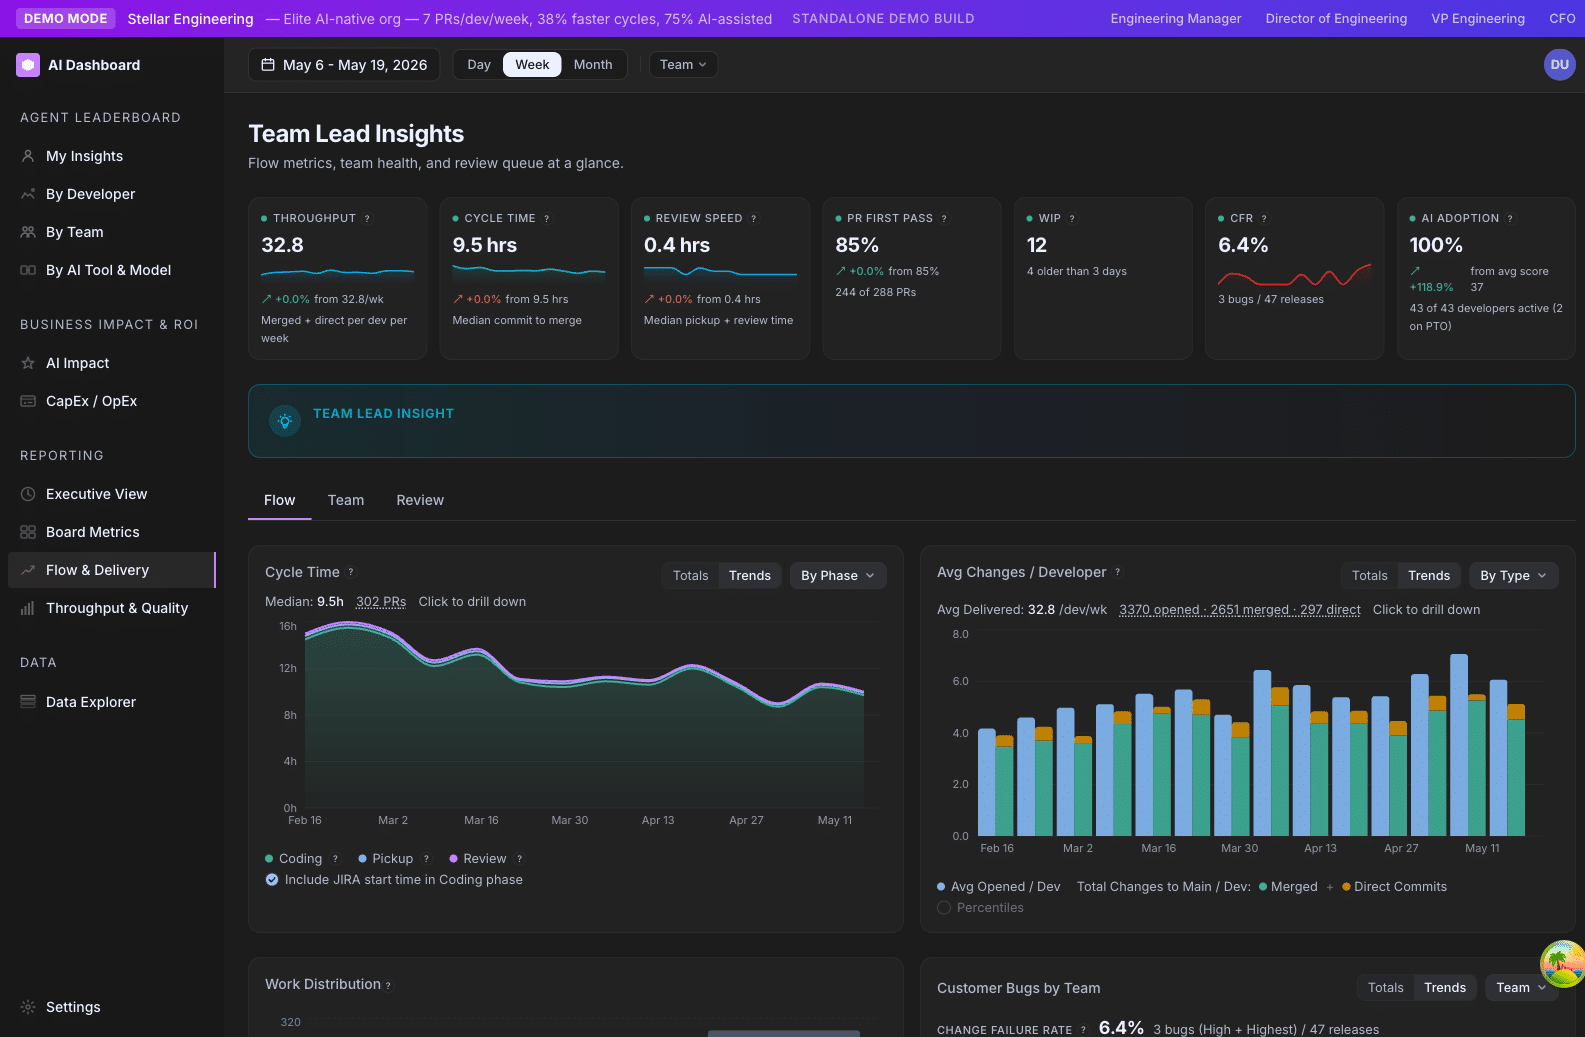
Cycle Time
Total hours from a PR’s first commit to its merge (and optionally to deploy). The headline operational health metric — how fast work flows from idea to shipped.
- Family
- Flow & Cycle Time
- Cadence
- Per PR, aggregated for views
At a glance
Cycle Time is the single most informative operational metric in the dashboard. It answers “how long does it take a piece of work to go from first keystroke to merged?” Lower is generally better — but the composition of the time (which phase dominates) matters more than the total. A 5-day Cycle Time made of 1 day Coding + 4 days Pickup tells a very different story than one made of 4 days Coding + 1 day Pickup. The phase breakdown is the part to read first.
Formula
Cycle Time = Coding + Pickup + Review + Deploy

  Coding  = first commit → PR open
  Pickup  = PR open → first review activity
  Review  = first review → last review event
  Deploy  = merge → production deploy (if release detection is configured)
For a team or org view, Cycle Time is shown as an average (mean) across PRs in the window, with phase contributions visualized as a stacked bar or area.
How GitKraken Insights calculates it
The four phases. Cycle Time is decomposed into four phases. Each PR’s timestamps are computed and the phase durations are summed:
- Coding — from the PR’s first commit (
first_commit_at) to when the PR was opened (opened_at). Captures “writing the code before showing anyone.” - Pickup — from PR open to the first review-related event (first review comment, first approval, first changes-requested). Captures “PR is waiting for someone to look at it.”
- Review — from the first review event to the last review event. Captures the back-and-forth time.
- Deploy — from
merged_atto the production deploy timestamp. Only populated when release detection is configured for the repo. When release detection is not set up, the Deploy phase is omitted from the total rather than substituted with anything else.
The “Include JIRA start time” toggle. When this toggle is on (the default in the app), the Coding phase extends backward to include the time between when a JIRA issue moved to In Progress and the first commit. This converts Cycle Time into “time from team-committed to shipped,” which is the more meaningful business metric — but it requires consistent JIRA workflow discipline. Turn the toggle off if your team doesn’t use JIRA or your in-progress workflow is inconsistent.
Aggregation. For a team or org row, we average the phase durations across all PRs merged in the window. Drafts are excluded. Bot-authored PRs are excluded.
Outlier handling. The metric does not trim outliers automatically. A PR that sat open for 90 days will heavily skew a 30-day average. The phase-breakdown views visualize the distribution so you can spot the long tail, and the median is shown on hover as a check against outlier-skewed means.
Why it matters
Cycle Time is the dashboard’s most reliable operational health signal because it integrates many smaller signals into one number:
- Slow Cycle Time usually means slow review (Pickup phase) — your highest-leverage fix.
- Sometimes it means PRs are too big (Review phase) — fix with size discipline.
- Occasionally it means stalled work (Coding phase) — fix with WIP discipline.
Cycle Time also correlates strongly with team morale. Developers who watch their PR sit open for three days disengage from the work and from the review process. Tight Cycle Time correlates with higher engagement, less work in flight, and more shipped iterations.
For AI adoption analysis, Cycle Time is the metric most likely to show adoption paying off in delivery. AI tools reduce Coding phase first; they then enable smaller PRs which reduces Review phase. Watching Cycle Time trend down alongside Adoption Score trending up is the canonical “AI is delivering value” story.
How to read it
Median industry numbers for typical web and services engineering teams:
- < 24 hoursElite — fast, lean teams with strong review discipline
- 1 – 2 daysStrong — typical for high-performing engineering orgs
- 2 – 4 daysFair — common in larger orgs; usually has Pickup or Review opportunity
- 4 – 7 daysNeeds attention — investigate phase breakdown
- > 7 daysStuck — review process broken, or PRs structurally too big
Always read the phase breakdown before drawing conclusions. The most common pattern in teams over three days is Pickup dominates — PRs sit waiting for review. The fix is almost always tighter review queue discipline, not faster coding.
Settings that affect it
- “Include JIRA start time” toggle (on Cycle Time charts). Requires JIRA integration. Default: on.
- JIRA integration (instance-level config) — without it, the JIRA-extended Coding phase is unavailable.
- Release detection — without configured releases, the Deploy phase is omitted.
No other admin settings affect Cycle Time. It is a measurement.
How to improve it
Listed by leverage — start at the top:
- Establish a weekly review-clearing ritual. Fifteen minutes per week to walk through the oldest open PRs. Decide: ship, give a deadline, or close. This single habit fixes the Pickup phase on most teams within 2–4 weeks.
- Right-size PRs. Teams with high Cycle Time and high Review Cycles are over-batching. Aim for PRs that can be reviewed in 15 minutes.
- Reduce reviewer load. A team with 6 developers and 25 open PRs has a reviewer problem, not a coder problem.
- Use AI to clean up small PRs. Routine small PRs (formatting fixes, tests, docs) lend themselves to AI-assisted shipping. Moving the long tail of small work to AI-assisted flow can free reviewer time for substantive PRs.
- Set a Cycle Time target as a team. A target like “median Cycle Time under 36 hours” gives the team a shared goal and makes the metric actionable rather than diagnostic.
Limitations and gotchas
- One outlier skews the mean badly. A PR that sat open for 60 days will dominate a monthly Cycle Time average. Always cross-check with the median.
- Cycle Time can’t see commits before the PR is opened that aren’t on a tracked branch. If a developer codes for three days on a local branch with no pushes, their Coding phase reads as ~0.
- JIRA-extended Coding requires discipline. If your team marks issues “In Progress” inconsistently, the JIRA-extended Coding phase becomes noisy.
- Deploy phase is binary — present or absent. Without release detection configured, the Deploy phase is just omitted.
- Bot PRs and drafts are excluded. Dependabot’s auto-merged dependency upgrades aren’t pulling down the average.
FAQ
Should I optimize toward “shortest possible Cycle Time”?
No. Push toward “predictable, low-variance Cycle Time.” A team with a tight 36–48 hour distribution is healthier than a team with a wild range from 4 hours to 4 days, even if the second team’s average is lower.
Why does our team’s Cycle Time look terrible the week before a release?
Pre-release weeks accumulate PRs that were held back for the release. They merge in a burst, but their Coding and Pickup phases stretched across the embargo. Normal artifact.
My team’s median is 18 hours but the mean is 72 hours. Which should I use?
Median tells you “what is typical.” Mean tells you “what is the headline number including outliers.” For leadership reports, lead with median; mention mean as a tail signal.
How is Cycle Time different from Lead Time?
Cycle Time is first commit → merge. Lead Time (DORA) is first commit → production deploy.
Related metrics
| Metric | Relationship |
|---|---|
| Review Cycles | The cause of long Review phase. Read together. |
| First-Pass Rate | Inversely correlated with Review phase length. |
| WIP | High WIP often causes high Pickup (reviewers overloaded). |
| Throughput | Outflow rate vs. how-long-each-takes. |
| Lead Time for Changes | DORA’s first-commit-to-deploy version. Similar but production-scoped. |
Where it appears
/ai-adoption/ai-impacttwo side-by-side Cycle Time cards: left = trend only, right = breakdown with dimension dropdown and Totals/Trends toggle. The Cycle-Time-by-AI-Tier view also lives here./ai-adoption/teamsCycle Time column on the team table; expanded rows show the trend with phase breakdown./ai-adoption/executiveCycle Time as one of the headline trend lines and a hero KPI./ai-adoption/developersper-developer cycle time in the expanded developer detail.