Find out what AI is actually delivering.
Last updated: September 2026
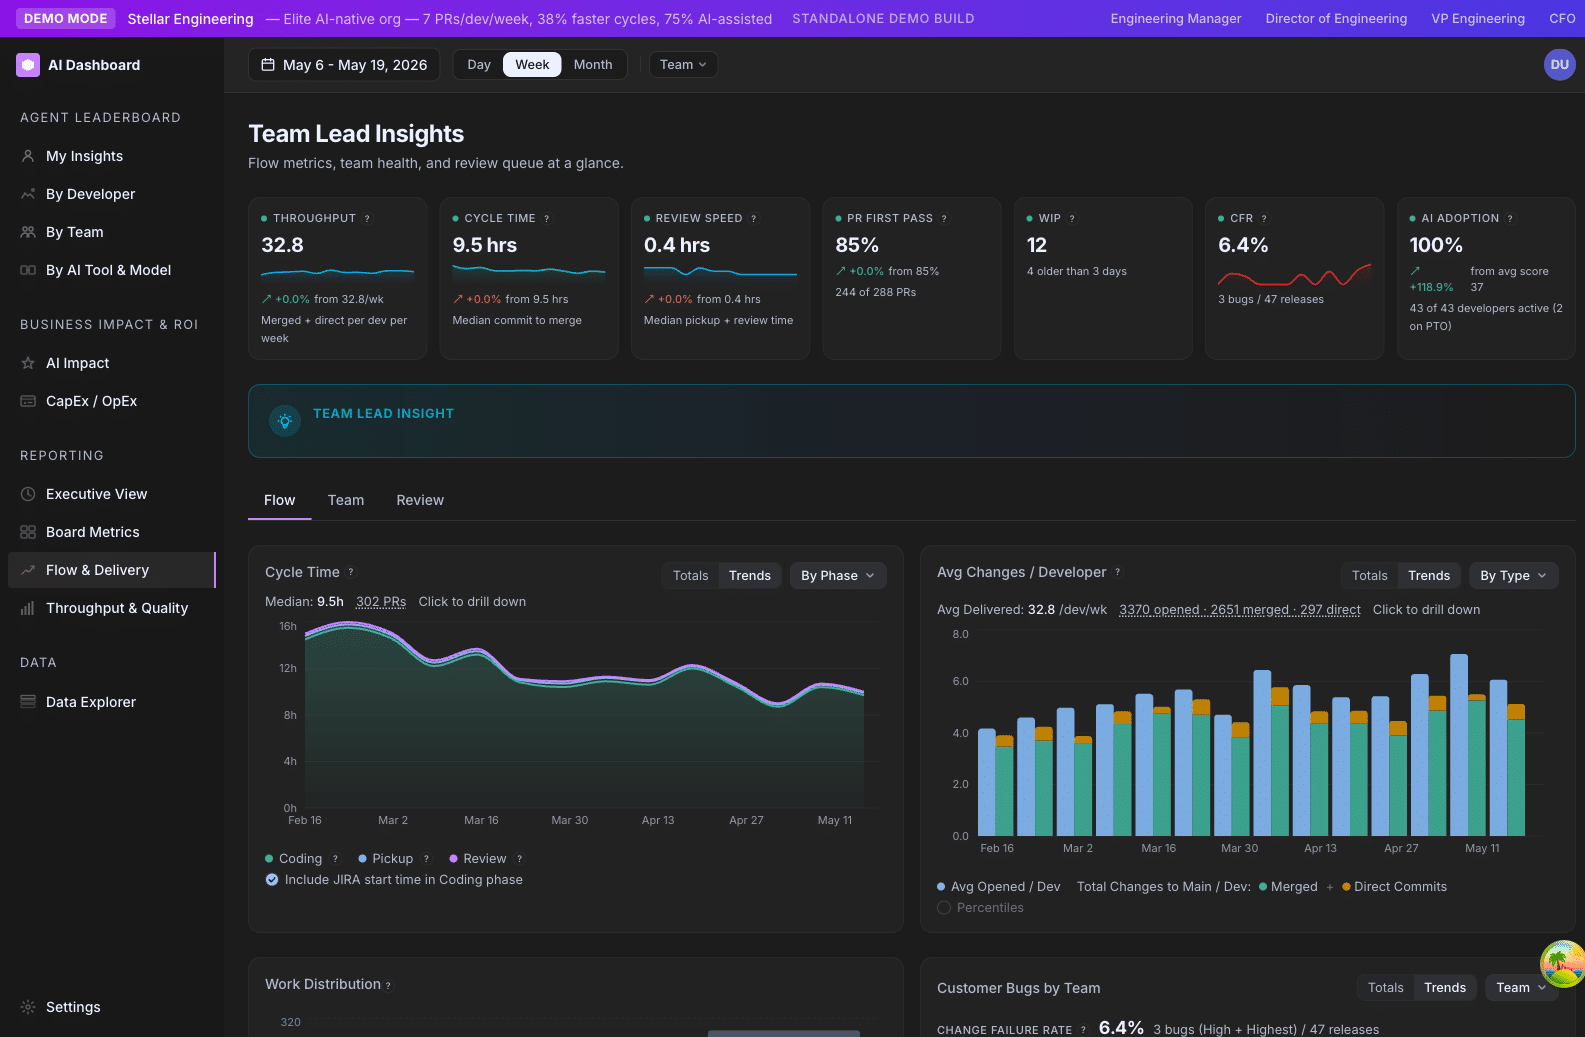
GitKraken Insights gives engineering leaders a single view of how AI tools, code delivery, and team capacity work together. The AI Adoption section measures how much your team is actually using AI, how autonomously, and what AI is actually delivering — in time and dollars.
Executive
Prove the investment
Adoption, productivity uplift, and the CapEx/OpEx split.
Engineering leaderFind the bottleneck
DORA, cycle time, and review load across your teams.
Team leadCoach the team
Per-developer adoption, without it becoming a performance review.
AdminConnect the data
Git providers, AI tools, trackers, and the settings that move scores.
The metric map
21 metrics · 5 familiesAdoption & Agentic5 metrics
DORA & Quality4 metrics
Dashed marks a setting or modifier that changes other scores rather than being a score of its own.
Plan: GitKraken Insights
Platform: Browser only via gitkraken.dev
Role: Lead, Admin, or Owner
Where AI Adoption shows up in the product
- /ai-adoption/developers — primary surface. Each row has Adoption, Agentic, Tier, and a heatmap.
- /ai-adoption/teams — team averages and tier mix bars.
- /ai-adoption/ai-tools-comparison — cohort comparisons (e.g. team A vs. team B, or Claude vs. Codex users).
- /ai-adoption/executive — hero KPI (“AI Adoption %”) and trend lines.
- /ai-adoption/ai-impact — autonomy deep dive and Business Impact / ROI.
- /ai-adoption/capex — CapEx / OpEx split as the primary surface.
- Adjacent surfaces in the same nav family: /ai-adoption/board-metrics, /ai-adoption/data-connections, /ai-adoption/data-explorer, /ai-adoption/settings/*.