First Dashboard
Last updated: September 2026
A guided 10-minute walkthrough of /teams, the page you land on when you log in. By the end you’ll know what every column means and where to click next.
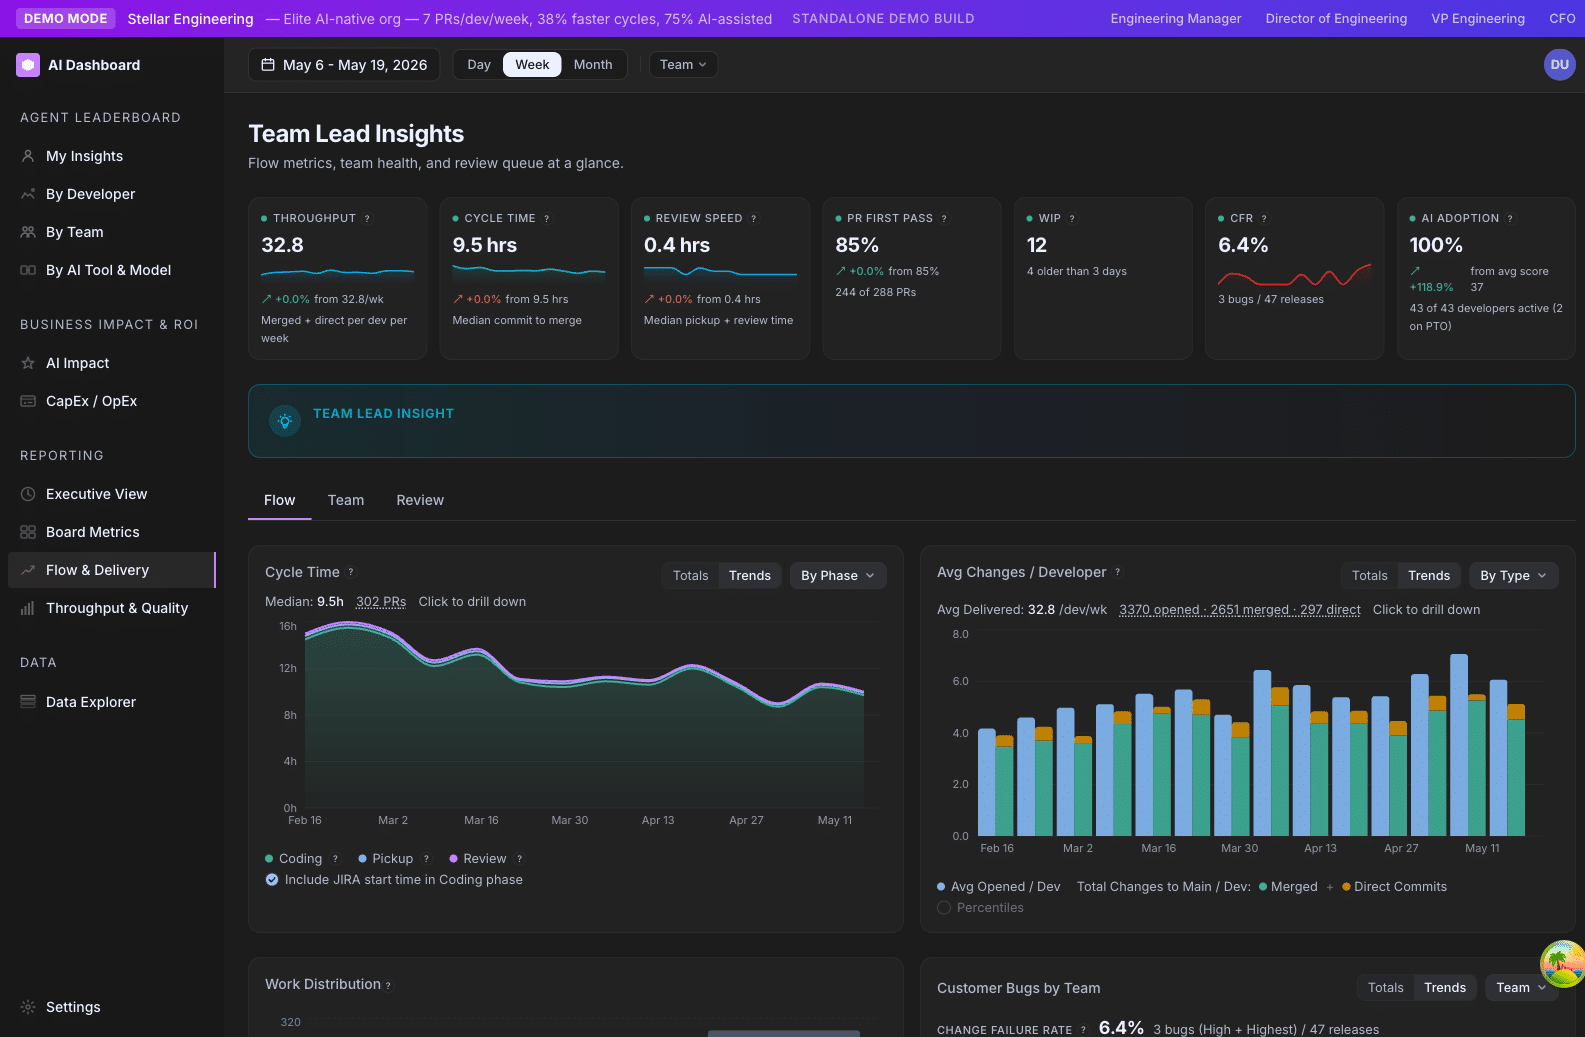
Set the scope first
Before you read anything, set two filters at the top of the page:
- Date range. Default is the last 14 days. For weekly reviews keep it at 14 days. For a quarter-end review, switch to 90 days. Sub-7-day windows force some rates to zero, so don’t pick “yesterday” expecting full data.
- Department or team. Pick the slice of the org you care about. If you have a
Default Departmentset in Settings, this comes pre-filled.
Everything below this point will reflect those two filters.
The team table — column by column
The main view is one row per team. Here’s what each column tells you:
Readiness
A composite “is this team set up to succeed with AI?” rating. Combines repository readiness (do they have AI tools wired in?), behavior (are developers actively using AI?), and outcomes (cycle time, output). Read as: green = no help needed, yellow = friction worth investigating, red = blocked.
Avg Adoption
The mean Agent Adoption Score across the team’s active developers. A team average of 50 means a healthy mix; 80+ means a high-adoption team.
Tier mix
Bars showing the team’s distribution across Power User / Regular / Explorer / Emerging. A team can have a great average and still be lopsided — e.g. half Power Users, half Emerging. The tier mix surfaces that.
Cycle Time
Average hours from a PR’s first commit to merge. Lower is generally better, but not always — see the Cycle Time section for nuance.
Output Score (per active dev)
Effort-weighted shipping rate, divided by the number of active developers on the team. A team that ships fewer but bigger PRs can have the same Output Score as a team that ships many small ones. Read this alongside the PR/DC count breakdown to know which pattern you’re seeing.
Power User %
Percentage of the team’s active developers in the Power User tier. Useful for tracking “where is AI adoption already mature” at a glance.
Expand a row to drill in
Click any team row to expand it. You’ll see three tabs:
Repos
Per-repo readiness. Helpful when a team’s Readiness score is dragged down by one specific repo that needs a config update.
Developers
The full developer roster for that team with individual Adoption Scores, Output Scores, AI Tier, and a Direct Commits column. Click any developer to drill further into their profile (this navigates to /developers).
System Metrics
Cycle Time + PR Volume trends for the team. Use the dimension dropdown to break either chart down by author, AI tier, or PR category.
What to look at first
In order, every time:
- Tier mix bars. Are any teams disproportionately Emerging? That’s the leading edge of an adoption problem.
- Avg Adoption vs Output Score. A team with high adoption and low output (or vice versa) deserves a conversation.
- Cycle Time outliers. Anyone over 4 days? That’s almost always a review-bottleneck or WIP problem, not a coding problem.
- Readiness reds. A red Readiness usually means a missing integration or a stale roster — quick to fix.
Where to go next
Now that you’ve read /teams, here are the obvious follow-up pages depending on what you saw:
| If you saw … | Go to … |
|---|---|
| A team with low adoption | /developers, filtered to that team — find the Emerging cohort |
| A team with slow cycle time | /flow-delivery → Flow tab → switch dimension to “phase” |
| A team with high output but low AI | /comparison → compare that team to a high-AI peer |
| A team you don’t recognize | /settings → Teams — check the roster |
| An exec asking “what’s the ROI?” | /ai-impact and /executive |
What the dashboard won’t show you (and why)
- Code quality at the line level. We don’t run static analysis or measure code health beyond cycle metrics. Use your existing tools (SonarQube, Code Climate, etc.) for that.
- Sentiment. A team can have great numbers and miserable morale. The dashboard is one input — your one-on-ones are another.
- Pre-2026-03-05 AI usage. Claude Code OTEL instrumentation started March 5, 2026. Anything earlier is undercounted.
Glossary refresher
- Active developer: is_active = true and shipped at least one PR or direct commit in the window and wasn’t fully on PTO.
- Window: the date range you selected at the top.
- P90: 90th-percentile cap computed across your whole active org. Sets the ceiling for normalized scores.
- Maturity Factor: an org-wide scaling knob (default 0.75). At 0.75, a P90 developer scores 75. Adjusts everyone’s tier ceiling.