Output Score
Effort-weighted shipping rate per developer or per team. Sums the complexity of every merged PR, direct commit, and formally reviewed PR in the window, weighting commits and reviews at half the rate of authored PRs by default.
- Family
- Output & Throughput
- Cadence
- Window-based
At a glance
Output Score replaces the older “Velocity” count on the developer table with a metric that scales with the work, not the count. Every merged PR and every direct commit carries an Effort Score (0.1 to 0.9, five discrete tiers). Output Score sums the effort across the window and credits reviewers for the PRs they formally reviewed — so a developer shipping one big architectural PR can match a developer shipping ten small fixes, and a senior who spent the window unblocking reviews still appears as a contributor.
Formula
Output Score (per developer)
  = SUM(PR effort)
  + DCWeight     × SUM(DC effort)
  + ReviewWeight × SUM(reviewed-PR effort)

Output Score (per team)
  = team total / active team developers
Where:
- PR effort =
COALESCE(effort_score, auto_effort_score, 0)summed over PRs the developer authored and merged in the window. - DC effort = same COALESCE, summed over direct commits the developer authored in the window.
- Reviewed-PR effort = same COALESCE, summed over PRs where the developer left a formal review (state
APPROVEDorCHANGES_REQUESTED). Each PR counts once per reviewer. - DCWeight = Direct Commit Weight setting (
direct_commit_weight; default 0.5; range 0–1). - ReviewWeight = Review Weight setting (
review_weight; default 0.5; range 0–1). Set to 0 to disable the review-credit term entirely. - Chore filtering — when “Exclude Chore from Output Score” is on (default), Chore-category items drop out of the effort sums (but not the displayed counts).
How GitKraken Insights calculates it
Effort scores. Every merged PR and every direct commit gets an Effort Score between 0.1 and 0.9 in five discrete tiers:
| Score | Tier | Roughly |
|---|---|---|
| 0.1 | Trivial | Typo, formatting, dependency bump |
| 0.3 | Light | Small bug fix, simple test addition |
| 0.5 | Moderate | Standard feature work, focused refactor |
| 0.7 | Substantial | Multi-component feature, non-trivial design |
| 0.9 | Deep | Architectural change, major migration |
Effort comes from an LLM classifier (auto_effort_score) and can be manually overridden (effort_score). The displayed value is the COALESCE of both.
Per-developer sum. For each developer in the window:
- Sum effort across their authored merged PRs (drafts and bots excluded; optionally Chore-excluded).
- Sum effort across their authored direct commits (bots and empty commits excluded; optionally Chore-excluded).
- Sum effort across PRs they formally reviewed (state
APPROVEDorCHANGES_REQUESTED; the same PR can credit multiple reviewers). - Multiply DC sum by
DCWeightand review sum byReviewWeight. - Add the three terms.
Team aggregate. For team rows on /ai-adoption/teams, the score is the team total divided by the count of active developers on the team. This per-active-dev rate is what makes team scores comparable across team sizes.
The Chore asymmetry. When the “Exclude Chore” toggle is on (default), Chore-category items are excluded from the effort sums — but the counts shown in the cell stay raw. So a developer who shipped 5 PRs and 12 direct commits will always show “5 PRs · 12 direct” in the breakdown, even if half were chores. This asymmetry exists so developers whose window happened to be mostly chores don’t disappear from the developer table.
Sub-week windows. For windows shorter than 7 days, the per-dev divisor uses per-row working weeks floored at a minimum, and the org P90 benchmark widens to a trailing 7-day cohort so the rate keeps meaningful resolution. Output Score itself is a raw sum and is unaffected by window length; the per-week rate-normalized variant (Output Norm, used by AI Tier) is what handles this widening.
NaN guard. If any input to the formula is NaN, Output Score returns 0.
Why it matters
Output Score is the dashboard’s answer to the chronic problem that raw PR counts mislead. A team that shipped one 0.9-effort architectural PR and a team that shipped nine 0.1-effort lint fixes should not score the same on shipping. Output Score puts them on a like-for-like footing.
The review-credit term matters for the same reason. A senior engineer who spent the window doing high-quality reviews on substantive PRs has produced real value; the older Velocity metric ignored that work entirely.
Output Score also threads cleanly into the AI Tier composite. Normalized to org P90 and scaled by Maturity Factor (we call that derived value Output Norm), it becomes the “shipping” leg of the composite alongside Adoption and Agentic.
For leaders, the most useful reading is Output Score over time alongside Adoption Score over time. AI rollouts almost always show Adoption rising first, then Output rising 4–12 weeks later.
How to read it
Output Score is a sum, not a rate, so absolute values depend on window length and team size. Some rough reads at the per-developer level for a 14-day window:
- ≥ 10High — multiple substantial-or-deeper PRs/commits/reviews
- 4 – 9Solid — typical shipping pattern for an engaged developer
- 1 – 3Light — small contributions, possibly maintenance work
- < 1Minimal — investigation worthwhile (PTO? big WIP PR not yet merged? infrastructure work?)
For teams, the per-active-dev rate is what to compare. A team averaging Output Score 7 per dev across a 14-day window is in good shape.
Settings that affect it
- Direct Commit Weight — scales DC contribution (default 0.5).
- Review Weight — scales review-credit contribution (default 0.5). Set to 0 to disable the review-credit term.
- Exclude Chore from Output Score — strips Chore effort from the sums (default on).
- Maturity Factor — does not affect raw Output Score, but does affect Output Norm (the variant that feeds into AI Tier).
How to improve it
- Right-size PRs. A team consistently shipping 0.1–0.3 effort PRs is over-fragmenting.
- Calibrate effort scores. If the LLM-assigned
auto_effort_scoreis consistently wrong for your team’s domain, have a senior engineer override the most miscategorized PRs. - Audit Chore exclusion behavior. On most teams the default reflects the right definition of “real output.” For an SRE team where dependency upgrades are the job, turn it off.
- Track Output trajectory, not the absolute number. Output Score that climbed from 4 → 8 per dev over a quarter is a stronger signal than a static 9 from a team that has been at 9 for a year.
- Pair Output review with WIP review. A team with low Output may have a lot of work in progress that hasn’t merged.
Limitations and gotchas
- Effort is an LLM estimate, not a measurement. Manual overrides exist for the most miscategorized cases.
- The score is a sum, so window length matters. A 14-day Output Score and a 90-day Output Score are not directly comparable.
- Chore filtering changes the score, not the counts. This is intentional but trips people up.
- Direct Commit Weight or Review Weight at 0 hides that term entirely from the score.
- Bots and drafts are excluded.
FAQ
Why was Velocity replaced with Output Score?
Velocity treated all PRs as equal-weight and ignored review work. That worked when PRs were uniform in size and scope. It stopped working as AI tooling enabled developers to ship dramatically larger changes. Output Score scales with effort, not count, and credits reviewers for substantive review work.
How is Effort Score assigned?
An LLM classifier worker reads each PR or commit diff and assigns one of five effort tiers. The rubric ignores LOC and focuses on the change’s apparent scope, intent, and complexity. See Effort Score.
Why is my Output Score 0 even though I shipped a big PR?
Three common causes: (1) the PR’s auto_effort_score hasn’t been computed yet, (2) the PR’s category is Chore and the “Exclude Chore” toggle is on, or (3) the PR merged outside the window you selected.
Why are direct commits and reviews weighted lower than authored PRs?
Empirically, direct commits trend toward smaller, less-reviewed work, and a single review takes less effort than authoring the same PR. The 0.5 defaults reflect those averages. Tune via Direct Commit Weight and Review Weight.
Can I see what effort score a specific PR got?
Yes. /ai-adoption/data-explorer → PRs tab shows the Effort column for every PR, sortable.
Related metrics
| Metric | Relationship |
|---|---|
| Effort Score | The per-PR / per-commit weights that Output Score sums over. |
| Throughput | Raw merged PR count. Use for same-team trend reading. Output Score is for cross-team comparison. |
| Direct Commits | The DC term of the formula. |
| AI Tier | Output Norm is the Output leg of the composite. |
| CapEx / OpEx Split | Categorizes the same effort sums for capitalization accounting. |
Where it appears
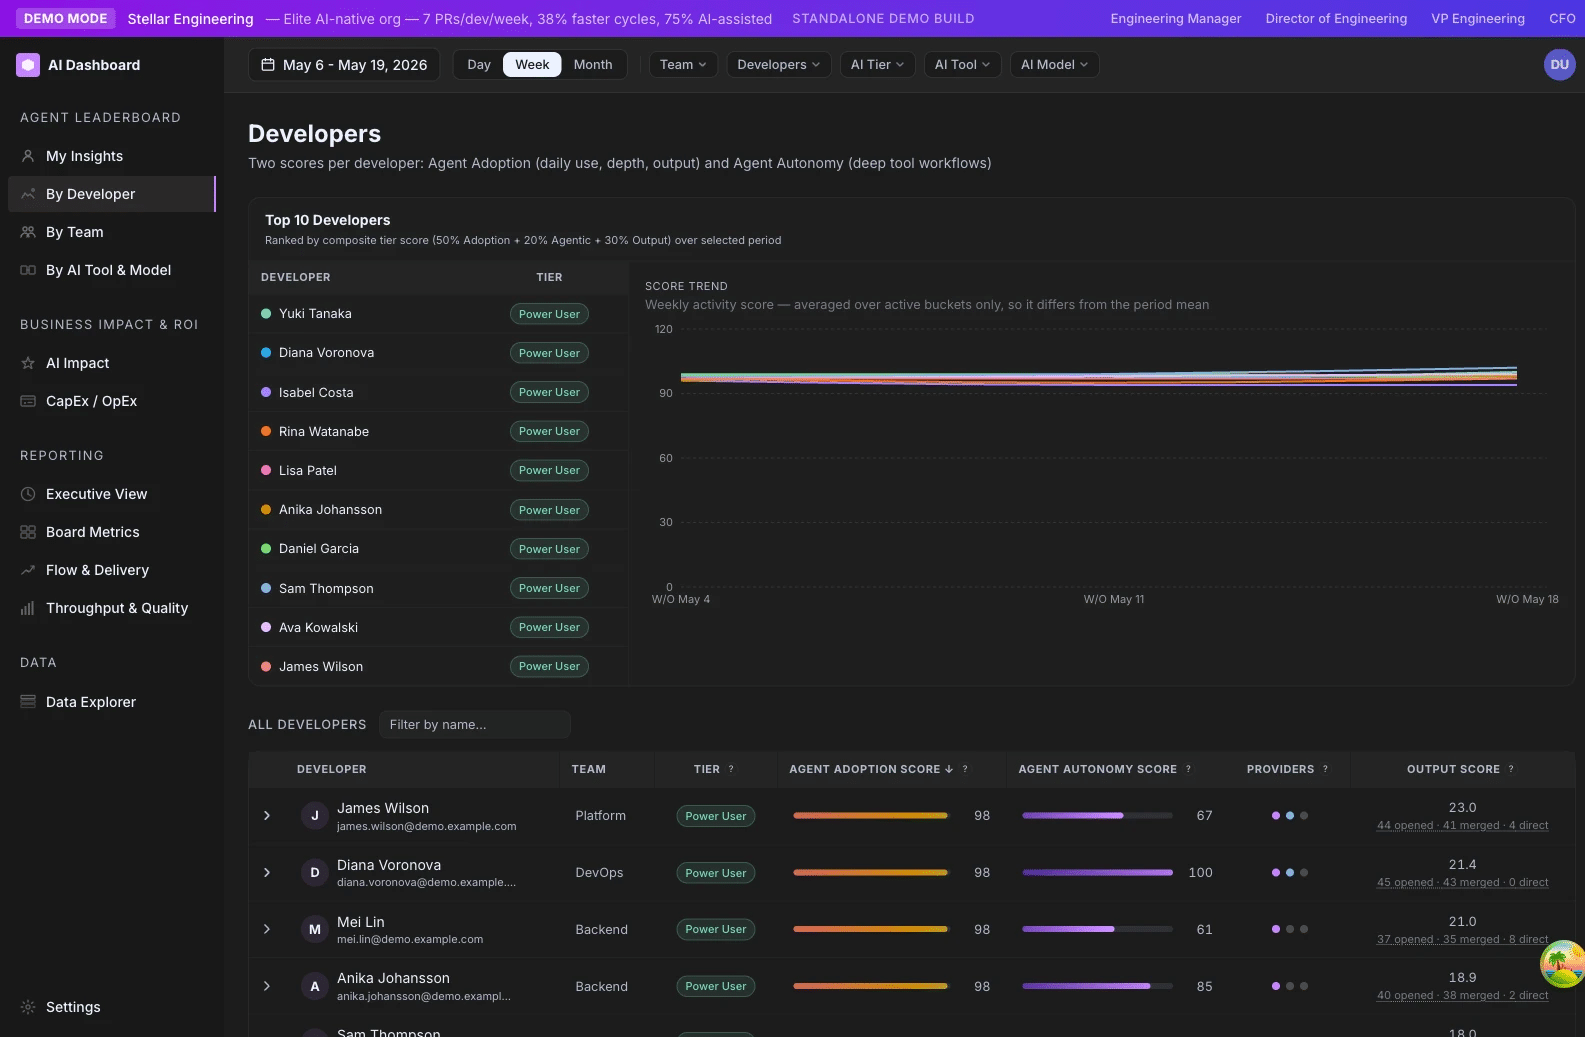
/ai-adoption/developersmain Output Score column. The cell breakdown reads “X opened · Y merged · Z direct” and is clickable./ai-adoption/teamsOutput Score per active developer column, sortable, with team aggregates./ai-adoption/ai-tools-comparisoncohort comparison uses Output Score as a key metric./ai-adoption/capexOutput Score with CapEx vs OpEx classification for the capitalization grid.