

Last updated: October 2026
Running several agents at once is easy. Knowing what they’re all doing is the hard part.
The Agent Graph draws it: every task, the sessions inside it, each turn, every tool call, every subagent, and the files the agents touch. It lays all of this out as a graph that updates live, with nodes appearing as the agents work. GitKraken has spent a decade drawing things developers otherwise hold in their heads. The commit graph did it for history, and the Agent Graph does it for agent work.
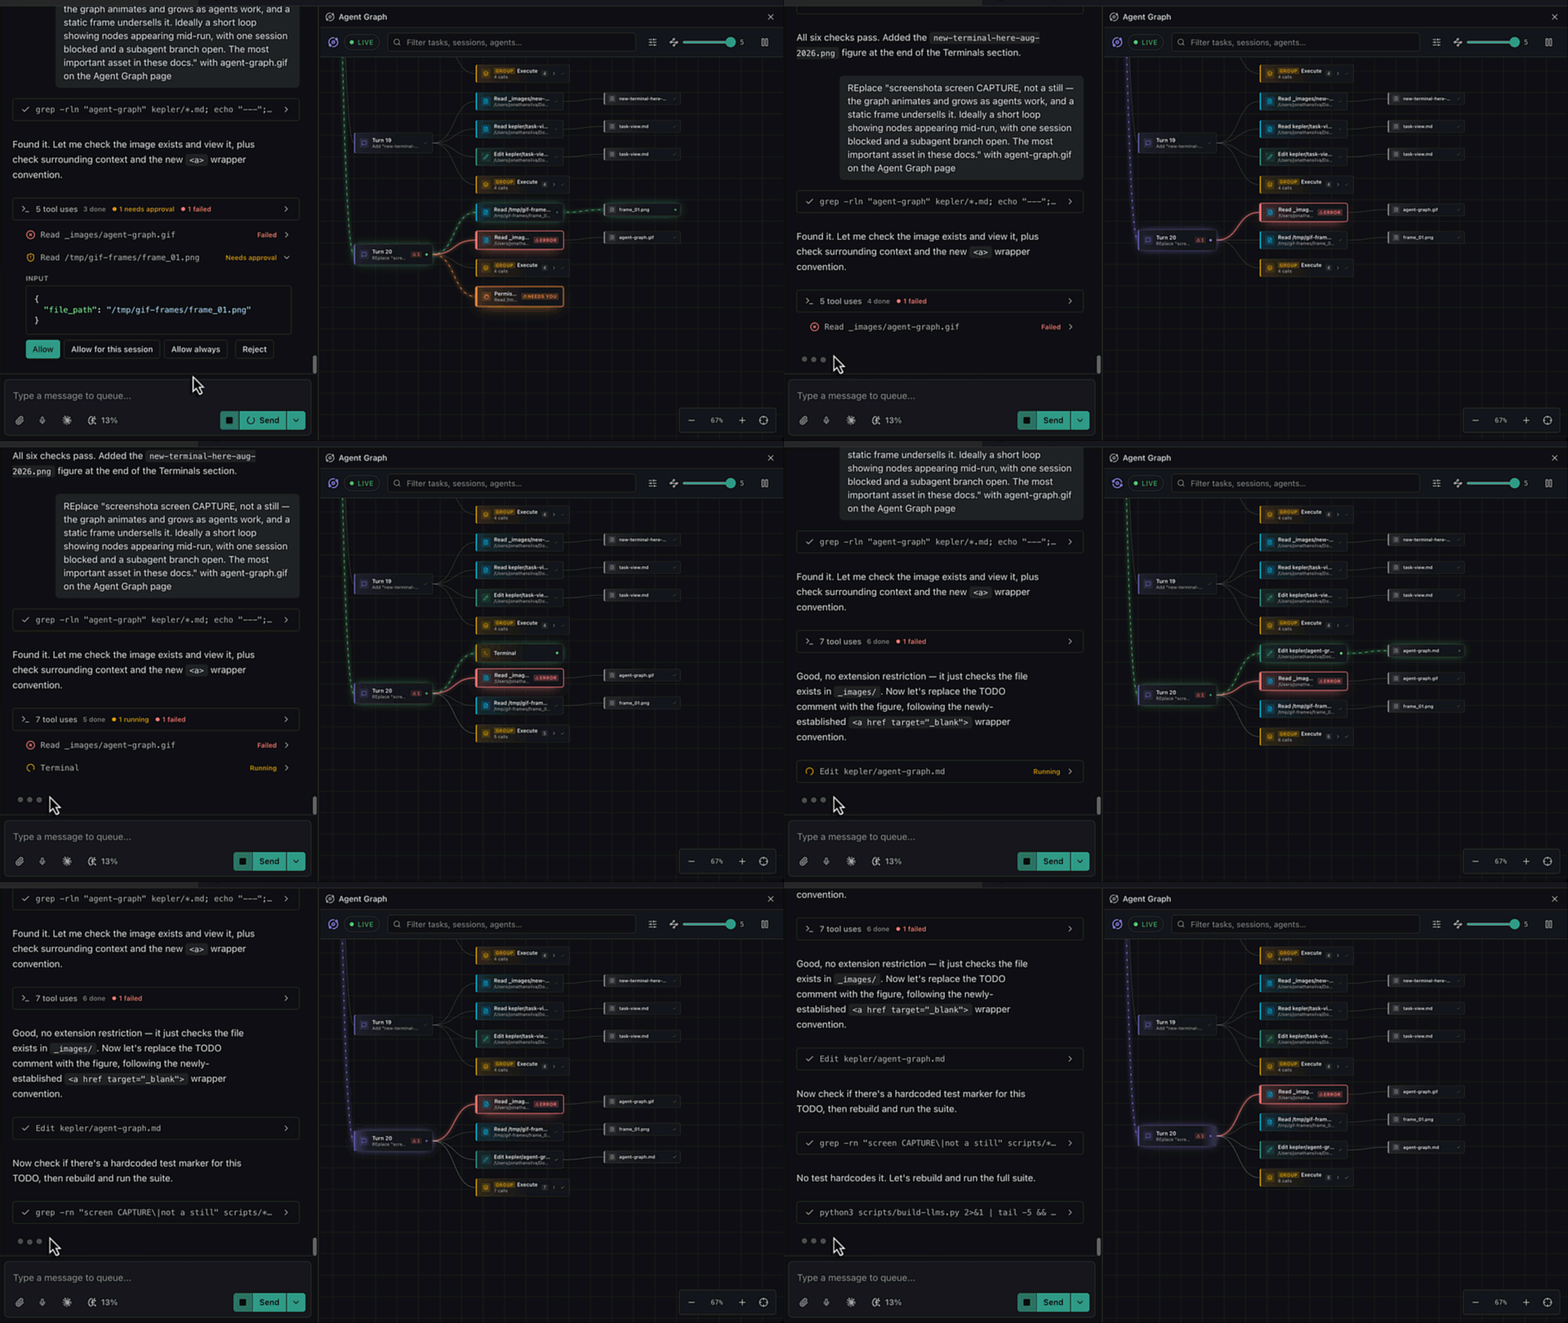
Open it

The graph is a segment of its own, beside Todo and Tasks in progress, rather than a way of arranging the list, because it replaces the list instead of laying it out.
| Where | How |
|---|---|
| The whole fleet | The top-left control: switch to the Agent Graph segment. Kepler remembers your choice across restarts |
| One session | The task view’s rail carries a per-session toggle on each session row, which docks that one session’s graph beside its transcript |
See Arranging Your Work for Todo and Tasks in progress, and for the List and Columns views those two segments offer. The Agent Graph has no page of its own, but rather it’s a segment of the main list and a pane within the task view.
When opened from the main list, the graph draws exactly what the list normally shows including your search and filter(s). Opened on a session, the graph starts fully expanded and grows downward (or to the right) with the conversation’s tool calls and subagents.
The graph is a visualization, not a workspace. To work in a session, open the agent session from your Task. The graph’s node details link straight through. To watch several agents at once and answer them, shift-click sessions to open them side by side instead; see The Task View.
How to read it
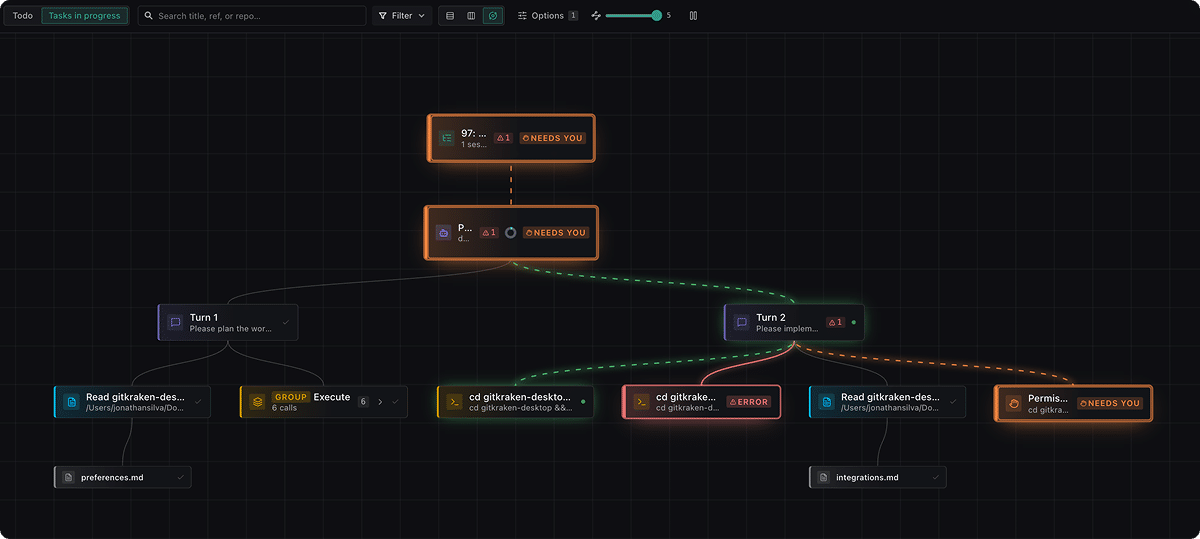
The graph is layered. Depth grows away from the root.
| Layer | What it is |
|---|---|
| Task | The root. One per task. See Tasks and Resources |
| Session | Each agent session in that task, with its agent and model |
| Turn | One exchange: Turn 1, Turn 2, and so on |
| Tool call | What the agent did in that turn |
| Subagent | A subagent the agent spawned, with its own tool calls beneath it |
| File | The files a call touched: the bottom layer, and where you notice two sessions converging on the same file |
Sessions that don’t belong to a task (external ones Kepler observed rather than started) collect under Unscoped sessions.
Two node kinds are worth spotting immediately, because nothing moves until you act: Permission needed and Question for you.
What a node’s state means
| State | What’s happening |
|---|---|
| Running a tool | Working right now |
| Waiting on the model | Thinking |
| Blocked | Waiting on you |
| Finished — unread | Done, and you haven’t looked |
| Done | Finished and seen |
| Stopped | You interrupted it |
| Failed | It errored |
| Idle | Nothing in flight |
Three states get a word on the card rather than a colour, because they’re asking for something: New, Needs you, and Error.
Tool calls are coloured by what they do
Read · Edit · Delete · Move · Search · Execute · Think · Fetch · Switch mode · Other
This is the fastest read on the graph. A task that’s all Read is still orienting; a wall of Edit means it’s committing to an approach.
Repeated calls of the same kind fold into one node badged Group, which keeps the kind as its name and reports the count and how many distinct files it spans. That way, a Read node reading 9 calls · 4 files doesn’t read as the same file nine times. Click a group to unfold it, and click again to fold it back up.
Click any node for detail
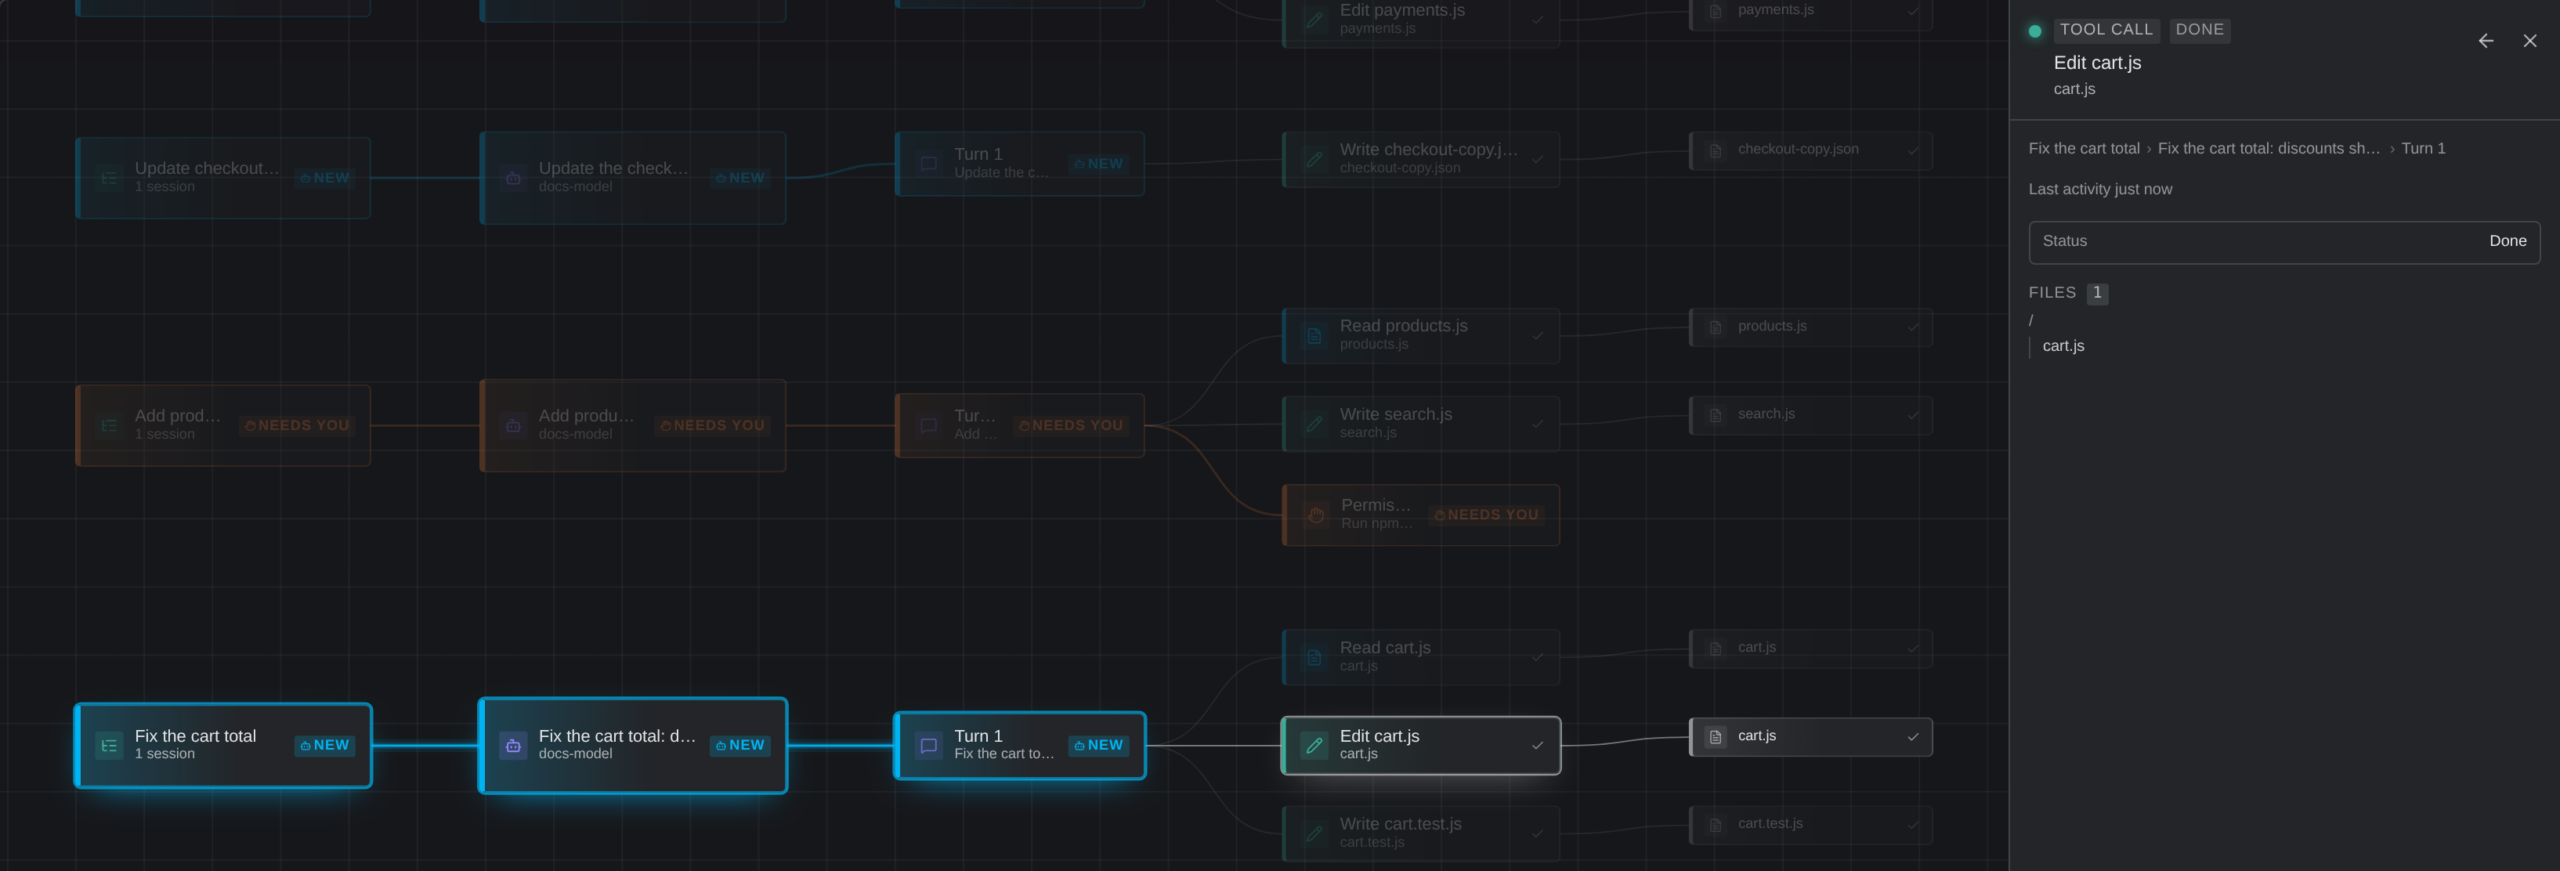
Selecting a node opens details beside the graph. What you see depends on what you clicked:
- Session: the agent, state, model, mode, context used, cost, where it’s running, and its stop reason.
- Tool call: the tool, the exact input, the files and paths it touched, how long it took, and how many calls failed.
- Subagent: its type, its prompt, and its own calls.
- Task: its status (Active, On hold, or Archived), its sessions, and its resources.
- File: a preview of the file. For a large file, the preview reads only its beginning.
Duration is only shown when Kepler actually watched the call happen. Replayed history can’t tell you how long something took, so the graph leaves it out rather than estimating.
From the details you can Open task or Open session to jump into the work, and Copy any input or prompt.
The stats rail
A rail down the right-hand side of the graph, reading top to bottom.
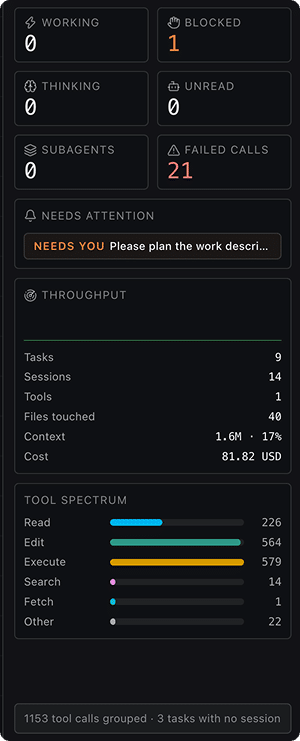
It’s the fleet’s numbers rather than its shape, drawn from the same snapshot the canvas draws, so the two can never disagree. On the dashboard the rail steps aside when you have a panel open.
The counters
Six tiles, two across, at the top of the rail:
| Counter | What it counts |
|---|---|
| Working | Sessions mid-turn with a tool actually executing |
| Blocked | Sessions that can’t move without you |
| Thinking | Sessions mid-turn with nothing executing: waiting on the model |
| Unread | Sessions that finished a turn you haven’t looked at |
| Subagents | Subagents in flight right now |
| Failed calls | Tool calls that errored, across the drawn graph |
Working and Thinking are split on purpose: a fleet that’s entirely waiting on the model is a different situation from one that’s entirely running commands, and a single “busy” number can’t tell you which you have. Blocked and Unread are the two that should pull you somewhere. Everything else is context.
Needs attention
Directly under the counters, and only when there’s something in it: everything asking for you, most urgent first, tagged Needs you, Error, or New. Each row jumps to its node, which is the point, because at three hundred nodes no per-node marker is findable.
Throughput
A trace of the fleet’s activity over time, and under it:
| Reading | What it tells you |
|---|---|
| Tasks / Sessions | How much is drawn |
| Tools | Tool calls in flight right now |
| Files touched | How many distinct files the drawn graph has reached |
| Context | How much context window your sessions have consumed, as a total and a percentage. Only sessions that report usage count, and the row is absent when none do |
| Cost | What the work has cost so far, in the currency your sessions agreed on. Absent when they report none, or report several |
Tool spectrum
The calls broken down by kind, with a bar and a count each: the fastest read on whether the fleet is reading, editing, or executing. Kinds with no calls yet don’t appear, and until any do the panel reads No tool activity yet.
Usage windows
Your agent subscription windows, one bar per window per agent. This panel appears only after you turn on Show plan usage for Claude Code, Codex and Augment in Settings → Agents → Usage limits. See Settings.
What was folded away
At the foot of the rail, a note counts what the readability rules removed from the canvas:
- Tool calls grouped.
- Sessions filtered out.
- Sessions Kepler can see but not trace.
- Tasks with no session.
Kepler reports this instead of staying silent, because a graph that quietly hides half the calls reads as “that’s all that happened”.
Finding things in a busy graph
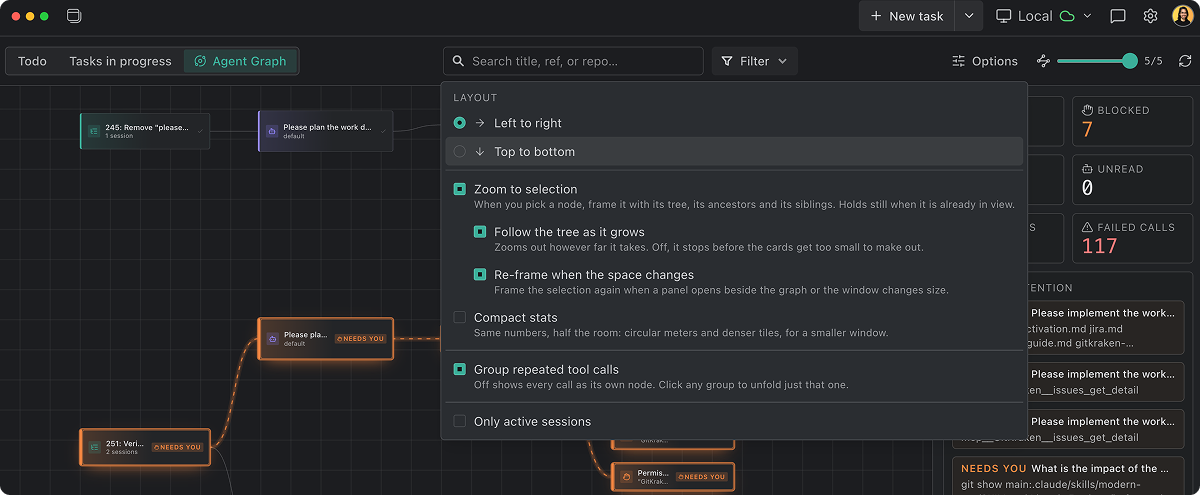
The graph’s header carries a search box, an Options menu, the depth slider, and the freeze control. Zooming lives on the canvas itself.
| Control | Where | What it does |
|---|---|---|
| Filter tasks, sessions, agents… | Header | Narrows the graph by name, across all three |
| Layout | Options | Grow the tree Left to right or Top to bottom |
| Zoom to selection | Options | Frames a picked node with its tree, ancestors, and siblings; holds still when it’s already in view. Two nested settings say when the camera may move again: Follow the tree as it grows (zooms out as far as it takes rather than stopping once cards get too small to make out) and Re-frame when the space changes (reframes when a panel opens beside the graph or the window resizes) |
| Compact stats | Options | Same numbers in half the room: circular meters and denser tiles, for a smaller window |
| Group repeated tool calls | Options | On by default. Off draws every call as its own node |
| Only active sessions | Options | Hide everything that isn’t running |
| Agent / Repo | Options | Narrow to one agent or repository. Not offered on the main list, whose own facets already do it |
| Detail depth | Header | How many layers deep the graph draws: up to five, four by default |
| Zoom in / Zoom out / Fit to view | Canvas | Move around. You can also pan by dragging, and press Escape to drop a selection |
Kepler remembers depth and layout per surface, so narrowing the graph on the main list doesn’t change what a session pane opens at.
Freeze it
A live graph moves while you’re trying to read it. Freeze the graph holds it still so you can inspect a node without it shifting. A chip beside the graph reads Live while it’s updating (with the moment of the last sample, so “live” is demonstrably live) and Frozen until you Resume live updates.

What it doesn’t show
Worth knowing, so you don’t read precision into it that isn’t there:
- No per-turn token counts. Agents report a context-window total, not tokens in and out per turn. The graph shows context fill and cost instead.
- No timings for calls it didn’t watch. See above.
- No cost or latency per subagent. No agent reports it.
- External and terminal sessions have no activity branch. Kepler can see that they exist but not what they’re doing, so they draw as leaves with a badge rather than looking idle.
- Transcripts don’t survive a Kepler restart. A session’s history is held in memory for the life of the backend, so a restart empties the branches beneath a session even though the session itself remains.
With nothing running at all, the graph reads Nothing running yet, with the hint Start an agent session and its activity appears here in real time. Once sessions exist but your filters exclude every one of them, the hint changes to No sessions match the current filters.
Early days
The Agent Graph is new, and a lot about it will change. It’s worth opening next to the agents you’re already running, and we’d like to know whether it actually helps. Feedback, in the top bar, opens Send feedback:
- Pick a Type: Feature request, Bug report, or General feedback.
- Write a Message.
- Send it.
Alternatively, share feedback to the public issue board at github.com/gitkraken/gk-ade/issues.
